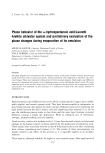
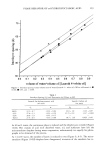
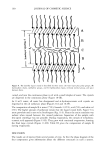
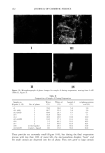
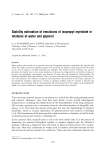
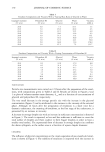
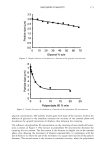
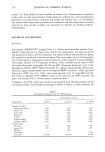
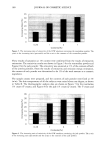
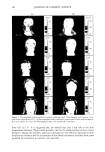
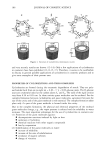
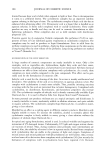
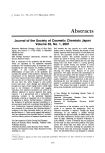
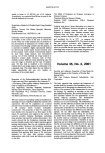
PHASE BEHAVIOR OF ot-HYDROXYOCTANOIC ACID 159 70 60 4o 30 0.0 0.1 0.2 0.3 0.4 0.5 0.6 0.7 0.8 0.9 volume of water/volume of [Laurcth 4+white oil] Figure 7. Interlayer spacing versus volume ratio of water/(Laureth 4 + white oil). White oil/Laureth 4: ß 0/100, ß 5/95, and x 10/90. Table I Interlayer Spacing (do) and Penetration (or) Values in LLC Laureth 4/ot-hydroxyoctanoic acid (wt ratio) Laureth 4/white oil (wt ratio) d o ot d o ot 100/0 32.5 -+ 0.7 -0.24 ñ 0.04 32.6 ñ 1.0 -0.23 ñ 0.07 95/5 27.0 ñ 3.3 -0.53 + 0.29 32.15 _+ 0.9 -0.37 ñ 0.061 92/8 28.0 _+ 1.9 -0.61 ñ 0.15 -- -- 90/10 27.9 ñ 0.9 -0.56 ñ 0.08 38.7 ñ 1.65 0.025 ñ 0.01 At 60 wt% water, the continuous phase is reduced and the droplets are crowded (Figure 10-II). The crystals of acid with dissolved water, oil, and surfactant have left the microemulsion droplets during water evaporation, unfortunately too rapidly for photo- graphs to be obtained of the process. At 14 wt% water, the number of layers is reduced to two (Figure 9, A-5). The micro- emulsion (Figure 10-III) droplets have disappeared, inversion of the emulsion has oc-

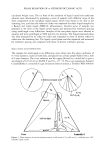
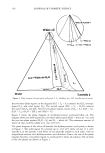
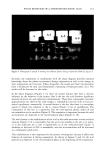
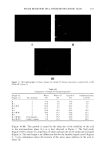
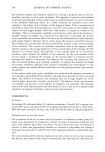
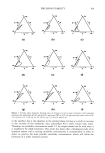
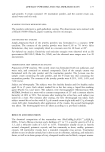
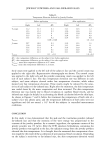
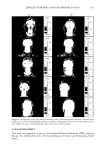
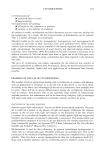
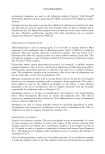
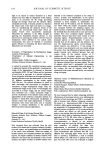
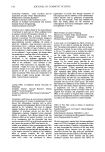
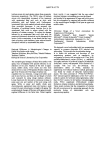
160 JOURNAL OF COSMETIC SCIENCE _ /m ' C B Figure 8. The lameliar liquid crystal is described by three zones: (A) water layer plus polar groups, (B) hydrocarbon chains, methylene groups, and (C) hydrocarbon chains, terminal methyl group, and space between them. curred, and now the continuous phase is oil with a small droplet of water. The crystals are dispersed in the continuous phase (Figure 10-III). At 0 wt% water, all water has disappeared and ot-hydroxyoctanoic acid crystals are dispersed in the oil surfactant phase (Figures 9-A and 10-IV). The composition of sample B is water (75 %), Laureth 4 (15 %), acid (5 %), and white oil (5%). The higher amount of surfactant means that the liquid crystal (LLC, Figure 5) is more prevalent and is seen to be birefringent (Fig. 11-I). Hence the entire emulsion was radiant when viewed between the crossed polarizers. Separation of the sample with low-speed centrifuge was not possible. During evaporation, the crystals of ot-hydroxy- octanoic acid appeared (Figure 11-II). They grew with continued evaporation, forming the final large crystals (Figure 11-III). Table III gives the composition of sample B during evaporation. DISCUSSION The results are of interest from several points of view. At first the phase diagram of the four components gives information about the different structures in such a system.
Purchased for the exclusive use of nofirst nolast (unknown)
From: SCC Media Library & Resource Center (library.scconline.org)