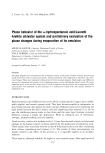
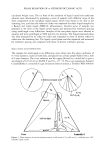
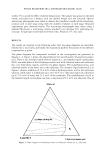
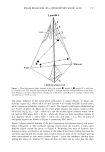
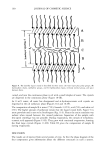
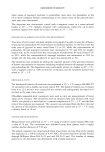
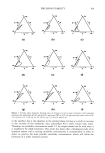
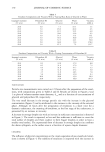
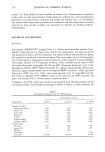
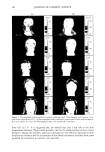
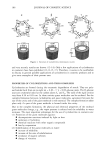
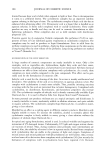
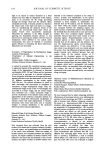
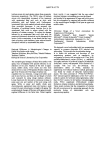
PHASE BEHAVIOR OF o•-HYDROXYOCTANOIC ACID 155 within iøC to avoid the effect of altered temperature. The sample was spread on the slide evenly, and placed on a balance until the desired weight loss was achieved. Optical microscopy photographs were taken to observe the interfacial transfer of the o•-hydroxy- octanoic acid in each stage along with the number of phases in each stage. Repeated experiments gave identical results. The microscope photographs were taken using a polaroid Microcam, a microscope camera attached to an olympus B11 polarizing mi- croscope. A high-speed and black-and-white film, Polaroid 337, was used. RESULTS The results are reported in the following order: first the phase diagrams are described, followed by x-ray results, and finally the evaporation path for the system of two different compositions is given. The phase diagrams for compounds involved in the investigation are presented in Figures 1-4. Figure 1 shows the phase behavior for water/Laureth 4/o•-hydroxyoctanoic acid. There is one isotropic liquid solution region (L2) , one lameliar liquid crystal phase (LLC), one solid phase of the o•-hydroxyoctanoic acid with dissolved water and surfactant (S1), two three-phase regions, and five two-phase regions. The o•-hydroxyoctanoic acid dissolved neither in the water nor in the surfactant. The isotropic liquid solution (L2) in Figure 1 shows a solubility of 22.0 wt% of the o•-hydroxyoctanoic acid in the surfactant solution, while water is solubilized up to 20.3 wt% in it. The solid region (S•) dissolved up to 27.6 wt% of water and 31.4 wt% of the surfactant. The solubilization of acid in the lameliar liquid crystal phase was low a maximum of 6.5 wt% was observed. One of White oil Figure 3. Phase diagram of o•-hydroxyocranoic acid/Laureth 4/white oil. Sj: solid area.

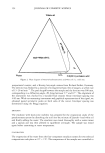
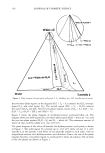
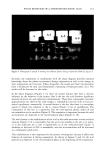
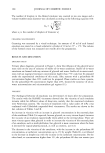
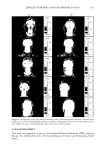
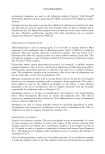
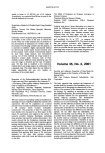
156 JOURNAL OF COSMETIC SCIENCE White oil • ureth4 • L2 + Whiteoil t.cc+w•.• L2 + LLC + V•nite oil LLC+White oi!+H20 a,O+LLC LLC Water Laureth 4 Figure 4. Phase diagram of water/white oil/Laureth 4. L2: solubility area. LLC: lameliar liquid crystal. the two three-phase regions in the diagram (LLC + L 2 + S1) connects the LLC, isotropic liquid (L2), and solid region (S1). The second region (LLC + S• + H20 ) connects the water with S• and LLC. The five two-phase regions consist of (L2 + S•), (LLC + S•), (LLC + L2), (H20 + LLC), and (H20 + S•). Figure 2 shows the phase diagram of o•-hydroxyoctanoic acid/water/white oil. The diagram shows one solid regions (S•), one three-phase region (H20 + white oil + S•), and the two two-phase regions (H20 + S1) and (S• + white oil). The maximum amount of white oil that could be added to S• was 41.8 wt%. The phase diagram of the white oil/Laureth 4/o•-hydroxyoctanoic acid system is shown in Figure 3. The solid region (S•) extends up to 41.8 wt% white oil and 31.4 wt% Laureth 4, as the Laureth 4 and white oil are mutually soluble in each other, with an insignificant amount of o•-hydroxyoctanoic acid dissolved. Hence, the rest of the phase diagram becomes a two-phase region, S• and Laureth 4 white oil solution. The tie lines of the two phases are shown in Figure 3.
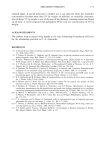
Purchased for the exclusive use of nofirst nolast (unknown)
From: SCC Media Library & Resource Center (library.scconline.org)