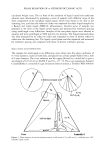
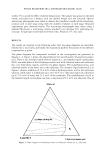
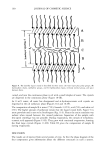
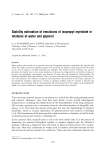
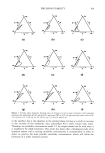
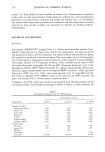
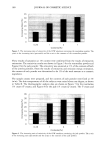
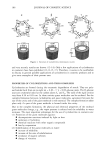
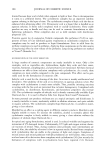
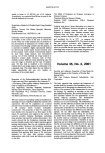
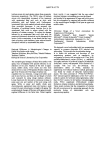
PHASE BEHAVIOR OF o•-HYDROXYOCTANOIC ACID 153 calculated weight ratio. The tie lines of the emulsion of liquid crystal and surfactant solution were determined by preparing a series of samples with different ratios of the three components in the one-phase liquid region, which were chosen to be close to the demixing line, and then the refractive index was measured for these liquid samples by a Bausch and Lomb model ABBE-3L refractometer. Another series of samples was prepared at the limit of the liquid crystal region and measured for interlayer spacing using small-angle x-ray diffraction. Samples of the two-phase region were allowed to separate and were centrifuged at 5000 rpm for two minutes. The liquid separated phase was then measured for its refractive index and compared to those of known refractive index near the demixing line. The liquid crystal phase was also separated and measured for interlayer spacing and compared with those of known interlayer spacing. SMALL ANGLE X-RAY DIFFRACTION The samples for small-angle x-ray diffraction were drawn into fine glass capillaries of 0.7-mm diameter, sealed at both ends, and placed into a brass sample holder with a hole of 2-mm diameter. The x-ray radiation was Ka copper filtered by a nickel foil to give a wavelength of 0.1542 nm at 40,000 V and 18 x 10 -3 •. The x-ray equipment, Siemens Crystallallofiex 4, consisted of a gas ionization detector system, a Tennelec PSD 100 flow ydroxyoctanoic acid LLC+L•+S• HzO+S• LLC+S•+H•O L2+ Sl LLC Water Laureth 4 Figure 1. Phase diagram of water/o•-hydroxyoctanoic acid/Laureth 4. S•: solid area. L2: solubility area. LLC: lameliar liquid crystal.

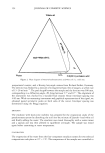
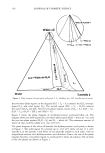
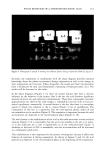
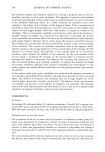
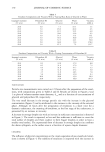
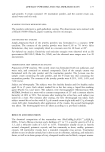
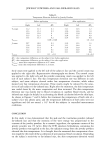
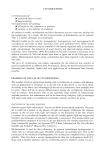
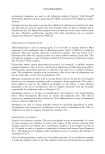
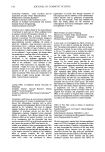
154 JOURNAL OF COSMETIC SCIENCE White oil F120+White oil+S2 Water a2o• 2-hydroxyoctanoic acid Figure 2. Phase diagram of water/ot-hydroxyoctanoic acid/white oil. S2: solid area. proportional counter, and a Kiessig low-angle camera from Richard Seifert, Germany. The detector was flushed by a mixture of nitrogen/methane, free of oxygen, at a flow rate of 15-20 ml min -•. The path length between the sample and the detector was 500 mm, corresponding to a diffraction angle, 2{}, lying between 5.7 ø and 0.7 ø. The alignment of the instrument was checked by a standard lead stearate whose interlayer spacing was 4.82 nm. With our measuring instrument and graphical representation of the signal, we obtained paired symmetric peaks on both sides of the center. Interlayer spacing was determined using the Bragg equation. EMULSION The emulsion with short-time stability was prepared for the evaporation study of the pseudoternary system by dissolving the acid into the mixture of Laureth 4 and white oil and finally adding the water. The emulsion was mixed thoroughly with a vortex mixer and a spatula and was then allowed to equilibrate overnight. The sample was mixed again before examining at room temperature. EVAPORATION The evaporation of the water from the four-component emulsion system for two selected compositions took place at 22 ø + IøC. The temperature of the sample was controlled to
Purchased for the exclusive use of nofirst nolast (unknown)
From: SCC Media Library & Resource Center (library.scconline.org)