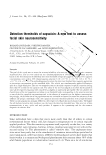
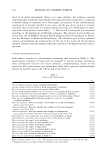
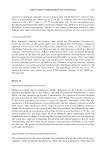
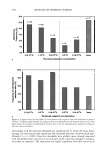
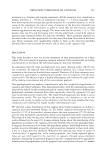
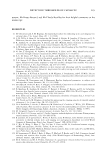
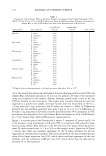
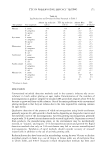
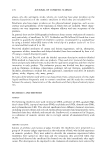
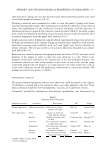
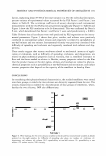
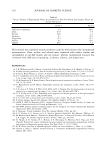
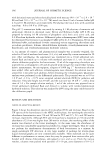
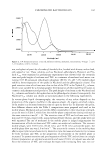
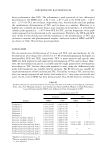
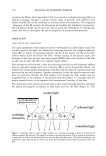
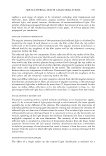
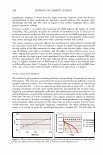
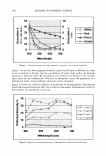
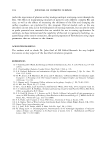
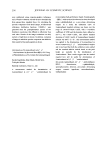
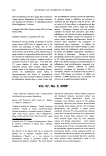
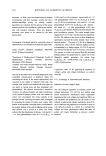
202 JOURNAL OF COSMETIC SCIENCE 50 10 .:ii:: 40 8 � � -D- \Nhite C in_ 30 C 0 6 .# e • Red i. =-m L 6� • Black 0 ar 20 4 u, I u, .c .c Green cc 10 2 cc 0 a 400 500 600 700 'Wavelength Figure 7. Absorption spectra of single pigments dispersed in oil-in-water suspension. Figure 7 we see that white pigment absorbed a great deal of light at 400 nm, but what is not considered is the fact that the contribution of violet light within the daylight spectrum is relatively small. By multiplying the intensity distribution of the incident light source by the transmission, reflection, or absorption curves, the appearance of a formulation under certain lighting conditions can be calculated. Figure 8 shows the reflected intensity distributions of mixed-pigment formulations when CIE standard illuminant D65 was incident on the sample. Formulations 2 and 6-8 from Table I are represented in the plot. � tll C m 40 30 -cs 20 m m 1( 400 H 500 " I 600 'Wavelength (nm) H � 700 -a- Form. 2 • Form. 6 -,w,..-Form. 7 ----Form. 8 Figure 8. Reflected intensity distributions of formulations illuminated by D65 lamp.

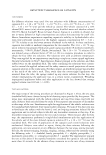
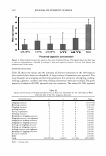
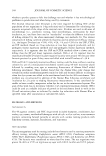
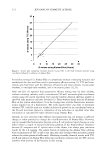
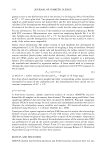
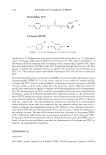
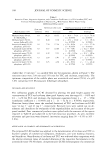
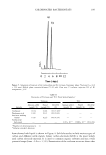
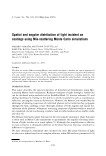
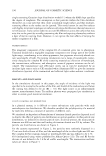
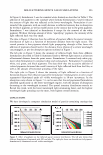
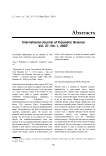
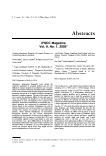
MIE-SCA TTERING MONTE CARLO SIMULATIONS 203 In Figure 8, formulation 2 was the standard white formula as described in Table I. The addition of red pigment to the standard white formula (formulations 2 and 6) reduced the amount of light that was reflected at the lower wavelengths. Formulation 8 con- tained all the pigments, with an overall decrease in reflected intensity due to absorption by the black pigment, as well as modifications to the contour due to the green pigment. Formulation 7 was identical to formulation 8 except for the removal of the white pigment. Without the large amount of white "opacifying" pigment, the intensity of the light reflected back was very small. The data in Figure 9 illustrate how the addition of pigment affects the spatial intensity distribution of light as a function of horizontal distance from the light source. The central premise is that pigments absorb light propagating through a film hence the addition of pigments should restrict the distance that a photon of a certain wavelength can propagate, as per the absorption spectra outlined in Figure 7. The left plot in Figure 9 shows the intensity of reflected light from three different formulations described in Table I illuminated under a 400-nm light source as a function of horizontal distance from the point source. Formulation 2 contained only white pig- ment while formulation 6 contained white and red pigment. Formulation 8 contained white, red, green, and black pigments. The data show that the successive addition of colored pigments decreased the overall intensity of light reflected back from the film, as well as the amount of horizontal spreading of the light. The right plot in Figure 9 shows the intensity of light reflected as a function of horizontal distance from the point source for formulation 3 (red pigments in oil-in-water suspension) illuminated under all visible wavelengths in 50-nm increments. In the absorption curve shown in Figure 7 it can be seen that the red pigmented formulation absorbed significantly in the lower wavelength regime, with the amount of absorption decreasing as the wavelength increased. The spatial intensity distribution exactly re- flected this trend, with the lower wavelength light attenuating faster, and the highest wavelength light spreading out the most, with highest overall intensity. CONCLUSIONS We have developed a computer simulation model of particle-containing coatings that 1.IIE-112 1.IIE-04 1.IIE-lli -Fonn2 --Fonn6 FormB 1.IIE-111 a: 1.IIE-'11 Distance ttom source .-ncmns) Distance 1i'DmSOta"ce (Miaons) Figure 9. Effect of pigments on the reflected spatial intensity distribution. The left plot shows three different formulations illuminated with 400-nm light. The right plot shows one formulation (red pigment, formulation 6) illuminated over all visible wavelengths.
Purchased for the exclusive use of nofirst nolast (unknown)
From: SCC Media Library & Resource Center (library.scconline.org)