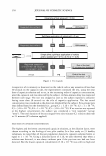
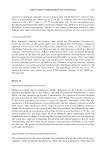
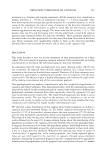
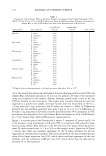
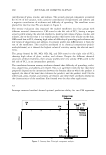
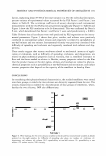
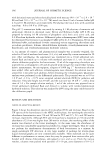
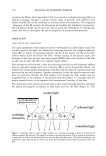
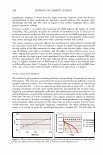
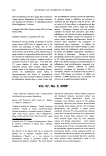
200 JOURNAL OF COSMETIC SCIENCE roughnesses, keeping in mind that the single-scattering Gaussian slope distribution approximation is most applicable for relatively smooth surfaces. The incident light ,vavelength was 600 nm. We show in Figure 6 how surface roughness affects some optical properties of films. In Figure 6 (left) it is ,evident that increasing the RMS slop:'. of the surface of a film containing TiO 2 particles increased the amount of transmirted ha.ze. ff there are no scattering particles within the film, the haze goes to zero as the RMS slope goes to zero. However, in this case, the turbid film itsel( contributed to the majority of the overall haze hence the high haze vaJue even with a perfectly smooth film surface. The surface roughness especially affected the distribucion of light reflected directly off the top surface of the film. This is exhibited in Figure 6 (right). The light bouncing off the top surface of the film maimains the same color as the incident light- :vhite in the case of ambient room light or sunliglu-and this effect is ,.,hat primarily gives rise co looks ranging from glossy to matte m flat (imagine a bright white spot on a glossy red apple, and how the spot sprea ls with roughness). For a film surface with an RMS slope of 0.02, appro'"imately 14% of the light reflected off the surface is deflected by more than 2.5 degrees, whereas ,vith an RMS slope of 0.16, almost 45 % of the reflected light is deflected by more than 2.5 cl grees. For a perfectly smooth surface with an RMS slope of 0, none of the surface-refle ·t d light is deflected by more than 2.5 degrees. FOJlMIJI.ATION WITH PIGMENTS Vf.T e modeled ight pigment-containing mixtures corresponding to hypothetica] coating formulations. The mixtures contained several tyJ)es of particles having different sizes and com pl· x refractive indices. An oil-in-water emul.sion base was modeJed by considering the oil drop.lets (RI = 1.4) to be spherical particles dispersed in water (RI = L33). By running simulations over the entire visible spectrnm, incrementing the incident wave- length by a set amount, absorption, reflection, and transmission curves were derived. lor each formulation, we performed simulations over seven wavelengths in the visible region (400 nm-700 nm) in 50-nm increments. The complex refractive indices of materials vary as a function of incident wavelength, and so the input parameters were changed for each simufotion. Some matefr- ls have RI values that are nearly constant over the entire visible spectrum, with negligibJe imaginary components, bur when simulating pig- ment , it is crucial to input th: wavelength-dependem complex Ris. The RI values of '911] 00.1 89..9 89.7 0 O.Ot 008 �sope 0.16 Anwe Figure 6. Effect of surface roughness on transmitted haze (left) and angular distribution of light reflected off the top surface of the film (right) for a film of titanium lioxide dispersed in oil.

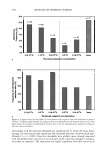
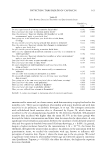
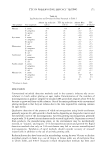
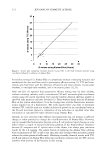
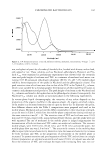
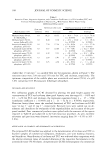
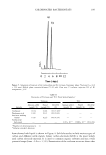
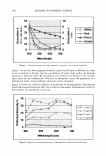
MIE-SCATTERING MONTE CARLO SIMULATIONS 201 even relatively common materials such as Ti02 vary widely in the literature here we used theoretical RI values (13) for white, red, and green pigments, and measured RI values for soot for the black pigment (14). The components of the eight mixtures are summarized in Table I. In order to investigate the effect of adding different components together, we fixed the concentrations of the individual components while only manipulating whether or not a given component was added to the formulation. Although the formulations were strictly hypothetical, the volume loadings were on the order of those used in base foundations for the face. Note that transmission, reflection, and absorption values were dependent on the particle size (distribution), loading percentage, and RI of the matrix. In Figure 7 the absorption spectra of single-pigment formulations are plotted, corre- sponding to formulations 2 through 5 summarized in Table I. In these simulations, the concentration of white pigment was an order of magnitude larger than other pigments, causing the effects of the white pigment to dominate. By default, the pigments were dispersed in an oil-in-water emulsion where the oil droplets were 1 micron in diameter and constituted 10% of the volume. While the fact of selective absorption by different pigments is obvious, use of the described simulation tool demonstrates how these effects can be quantified, as shown in Figure 7. The data in Figure 7 clearly show that the pigments selectively absorbed certain wavelengths of light. The white pigment absorbed light in the violet region (recall that there was an order of magnitude more white pigment in the formulation compared to the other pigments), but absorbed very little light at all at wavelengths above 500 nm. The lack of absorption over a wide range of wavelengths contributed to its white appearance. In contrast, the black pigment absorbed light over all the wave- lengths. The red pigment absorbed a large percentage of light at the lower wavelengths, with the percentage of light absorbed decreasing as the wavelength got closer to red light at 650 nm. The green absorption curve, to which the axis on the right side in Figure 7 applies exclusively, is bow-shaped, with a minimum in absorption at the wavelength of green light. The absorption curves in Figure 7 indicate the percentage of light, of any given wave- length, that is absorbed by the formulation. These results, however, do not take into account the intensity distribution of light incident on the sample. For example, in Table I Proportions of Various Components for Eight Hypothetical Coating Formulations Oil drops White Red Red Green Black (1-micron (600-nm (100-nm (1-micron (100-nm (100-nm diameter, 10% diameter, 2% diameter, 0 .1 % diameter, 0.1 % diameter, 0.2% diameter, 0.1 % volume load) volume load) volume load) volume load) volume load) volume load) ✓ 2 ✓ ✓ 3 ✓ ✓ ✓ 4 ✓ ✓ 5 ✓ ✓ 6 ✓ ✓ ✓ ✓ 7 ✓ ✓ ✓ ✓ 8 ✓ ✓ ✓ ✓ ✓
Purchased for the exclusive use of nofirst nolast (unknown)
From: SCC Media Library & Resource Center (library.scconline.org)