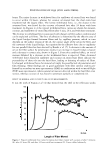
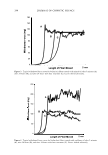
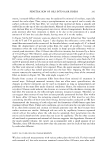
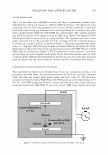
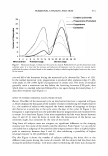
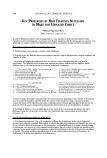
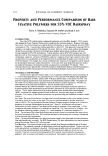
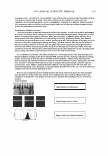
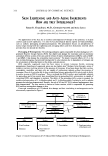
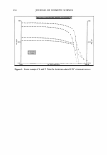
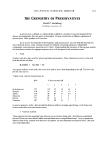
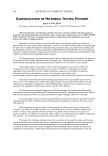
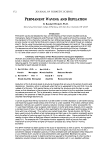
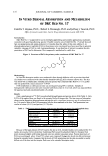
314 JOURNAL OF COSMETIC SCIENCE against the forehead and 1 ml of saline (Dulbecco's phosphate-buffered saline) was poured into the cup. The skin was scrubbed with a rubber policeman (ten strokes) and washed, and then the saline was aspirated and collected in 9 ml of PBS. The sample was analyzed for aerobic bacterial count: One milliliter of sample was diluted into 10-ml tubes of Difco's TAT broth base in order to obtain a 1:10 and 1:100 dilution. Also, 1 ml of sample was plated directly in Trypticase soy agar (TSA) (Fisher Scientific, Pittsburgh, PA) so that the samples containing lower counts of bacteria could be detected. All TSA plates were then incubated for 48 hours at 3 7° C and the colonies counted. The results were expressed as microorganisms per square centimeter of skin. To characterize the bacteria, gram staining was conducted. The grown populations were described by their genus if they appeared to be a certain majority. Plates having more variability in microflora required the use of BBL Crystal Mind software and identifica tion kits (Becton Dickenson Microbiology Systems, Becton Dickenson and Co., Cock eysville, MD) to further characterize some organisms (19). UV effects (20-21). Twenty female participants, ages 21-48, were selected for the study based on the inclusion and exclusion criteria listed above. The source of radiation was a xenon-arc Berger solar simulator (Solar Light Co, Philadelphia, PA) for UV-B irradia tion, using an interference filter with a range of 280 nm to 320 nm and a peak of 300 nm in addition to WG 320 and UG-11 filters. The test site was the backs of the subjects. The minimal erythemal dose (MED) of the subjects was obtained every week for eight weeks. Seven sites (- 2 cm in diameter) were exposed to UV-B in 25% increments, and erythema was visually graded after 24 hours. The minimal energy level (mJ/cm2) to induce a slightly pink erythema after 24 hours is the MED. These MED measurements were obtained every week for two months. During the course of the study, the subjects were instructed to refrain from applying any topical agents to their backs and to totally avoid exposure to the sun. DATA ANALYSIS Data were plotted versus the day in the cycle, considering as day 1 the day of the onset of menstruation. For each person, the day of the cycle was documented at each visit. For every physiological property measured in this study, frequency histograms were plotted, displaying the number of subjects showing the highest (or lowest) score at a particular day of the cycle versus the day of the cycle. RESULTS HORMONAL CHANGES Progesterone and estradiol levels from the blood work were correlated to the time of the month for each panelist. There was a large variability in the levels of estradiol (10--430 RLU, 30--400 picograms/ml) and progesterone (0-700 RLU, 0-2,800 ng/dl), and so the four measurements for each person (per month) were scrutinized and the day of the highest hormone level was recorded and referred to their day of the month. The histo gram of the number of subjects having the highest hormone level at a particular day of the cycle versus the days of the cycle is reported in Figure 1. Figure 1 also displays the

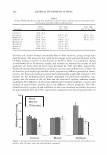
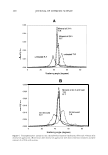
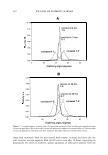
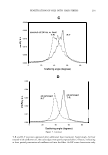
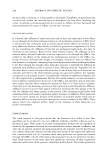
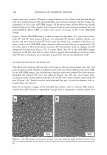
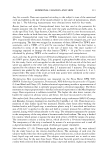
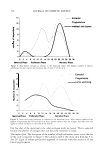
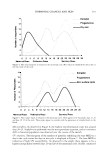
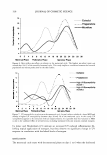
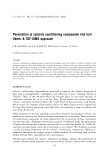
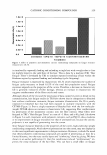
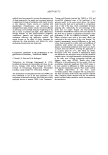
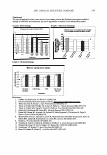
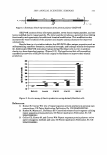
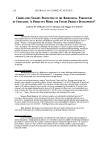
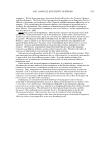
HORMONAL CHANGES AND SKIN 315 24 - - - - - - - Estradiol (published) - - - - - Progesterone (Published) 21 � 18 15 12 0 I- 9 11 6 z 3 0 2 4 6 8 10 12 14 16 18 20 22 24 26 28 30 Menstrual phase Frolif erative stage Secretory stage Figure l. Hormonal changes in blood over the course of a month. Published levels are the dotted lines with arbitrary units. It is cleat that the increase and reduction of hormones over the course of a month match published data when calculated based on the number of subjects exhibiting the highest levels over the course of the month. rise and fall of the hormones during the menstrual cycle, obtained by Toot et al. (22). In the normal menstrual cycle, progesterone is produced after ovulation (days 15-28), with peaks of 250-2,800 ng/dl of progesterone in serum (22). The levels of estradiol generally reach a maximum one day before the lutinizing hormone (LH) peak, after which there is a marked reduction followed by a rise again during the luteal phase, 5-7 days after ovulation (22) (Figure 1). EFFECT OF SYSTEMIC HORMONAL FLUCTUATIONS ON SKIN Barrier. The effect of the menstrual cycle on skin barrier functions is reported in Figure 2, which displays the histogram of the number of subjects exhibiting the weakest barrier (i.e., the number of subjects who required the lowest number of strippings to disrupt skin barrier at a certain day in the cycle versus the days in the cycle). In Figure 2, the histogram is superimposed onto the published data for progesterone and estradiol levels in serum. It is clear from Figure 2 that most respondents had the worse barrier between days 22 and 26. It must be borne in mind that the deterioration of the barrier was extremely slight, but consistent for the time of the month. Sting. Since all subjects were not stingers, no significant difference in the stinging response over the course of the month could be observed. From Figure 3 it can only be concluded that a subgroup of the panelists (the stingers) seems to have a slightly higher peak in sensitivity between days 2 and 12, thus exhibiting a possibility of higher neuronal response in the proliferative phase. Dry skin. Figure 4 shows the number of subjects exhibiting the driest skin at the different time points during the course of a month. All the subjects had the driest skin during the proliferative phase, with most subjects exhibiting the driest skin during the
Purchased for the exclusive use of nofirst nolast (unknown)
From: SCC Media Library & Resource Center (library.scconline.org)