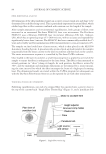
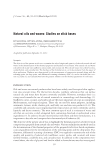
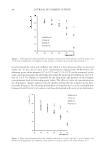
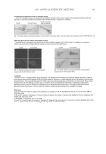
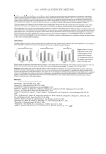
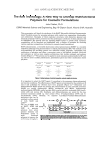
JOURNAL OF COSMETIC SCIENCE 108 PREPARATION OF STANDARD SOLUTIONS Stock solutions of 16 UV fi lters were prepared using different organic solvents due to their having various properties. Menthyl anthranilate (MA), 4-methylbenzylidene cam- phor (MBC), benzophenone-3 (BZ-3), benzophenone-8 (BZ-8), butyl methoxydibenzo- ylmethane (BMDM), octocrylene (OC), ethylhexyl dimethyl p-aminobenzoic acid (ED-PABA), ethylhexyl methoxycinnamate (EMC), p-aminobenzoic acid (PABA), iso- amyl p-methoxycinnamate (IMC), diethylhexyl butamidotriazone (DBT), and tere- phthalylidene dicamphor sulfonic acid (TDS) were prepared as 10000 ppm in MeOH and ethylhexyl triazone (EHT) as 10000 ppm in THF. Drometrizole (DT) was dissolved as 1000 ppm in MeOH, 2-phenylbenzimidazole-5-sulfonic acid (PBS) as 1000 ppm in the mixture of MeOH and 12% acetic acid (1:1), and methylene bis-benzotriazolyl tetra- methylbutylphenol (MBBT) as 1000 ppm in THF. The stock solutions were combined and diluted to become 1–50 ppm in MeOH. VALIDATION STUDY The linearity of UV fi lters was examined in the range of 1–50 ppm, except for 5–50 ppm for MBBT. The stability of stock solutions was determined to compare the correlation coeffi cients of the calibration curves one, three, and six days after their preparation. The intraday and interday variation for the determination of the 16 UV fi lters was carried out at concentrations of 10, 25, and 40 ppm. For the recovery study, the standard solution was spiked into cream and lotion matrixes that contained only basic ingredients for cos- metics. The spiked samples were weighed as 1 g and added to MeOH to become concen- trations of 15, 20, and 25 ppm. Each spiked sample was homogenized under sonifi cation and fi ltered through a 0.2-μm PTFE Acrodisc syringe fi lter (Port Washington, NY). Another standard solution and spiked sample set was prepared for EHT and MBBT, fol- lowed by the same procedure except for using THF instead of MeOH. The precision of the determination of the UV fi lters spiked in cream and lotion matrixes was tested at concentration levels of 10, 25, and 40 ppm. Each performance was carried out in tripli- cate. Additionally, other solvents such as 5% DMF in MeOH, EtOH, 2% Tween 80 in EtOH, isopropanol, and acetone were applied in choosing a suitable solvent for extracting UV fi lters from spiked samples. SAMPLE PREPARATION To monitor the concentration of UV fi lters in commercial sunscreens, 1 g of each sun- screen was weighed and diluted with MeOH or THF to adjust the concentration in the range of 1–50 ppm. The mixture was homogenized under sonifi cation and fi ltered through a 0.2-μm PTFE syringe fi lter. In the case of sunscreens containing EHT and MBBT, the sample solution was prepared using THF. The prepared standard solutions, spiked samples, and sunscreen samples were analyzed in an Agilent 1200 series HPLC system (Santa Clara, CA) with an injection volume of 10 μl. Each sample was contained in an amber vial to protect the light in ambient condition. HPLC CONDITIONS Sixteen UV fi lters in the present studies were analyzed using HPLC connected to a diode array detector (DAD). Chromatographic separation of the UV fi lters was carried out with

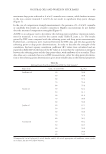
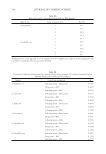
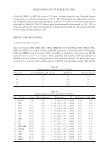
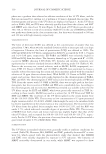
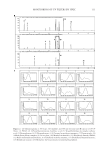
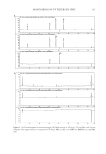
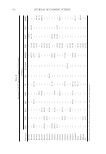
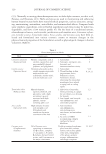
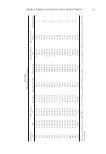
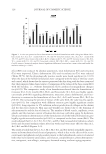
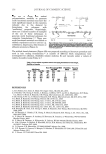
MONITORING OF UV FILTERS BY HPLC 109 a Cap Cell PAK C18 MG2 (4.6 mm × 250 mm, 4.6 μm of particle size, Shiseido, Japan) maintained at a constant temperature of 40°C. The mobile phase was followed by a gradi- ent of MeOH-sodium hydrogen phosphate (pH 4.0 0.01 M) in the volume proportions described in Table III. The UV fi lters were simultaneously determined at 300, 320, or 360 nm, and the detection wavelengths are summarized in Table IV. All analytical results were calculated from triplicate data. RESULTS AND DISCUSSION CHROMATOGRAPHIC ANALYSIS Twelve UV fi lters (MA, MBC, BZ-3, BZ-8, BMDM, OC, ED-PABA, EMC, PABA, IMC, DBT, and TDS) were readily soluble in MeOH to prepare a stock solution of 10000 ppm. EHT and MBBT were dissolved in THF, and PBS was prepared in the mixture of MeOH and 12% acetic acid (1:1, v/v) due to their solubility and stability. DT was prepared in MeOH as a stock solution 1000 ppm due to low solubility. Sixteen UV fi lters were sepa- rated in a C18 column with a mobile phase of MeOH and phosphate buffer. The mobile Table III Gradient Profi le for Analysis of 16 UV Filters Time (min) 0.01 M NaH2PO4 (pH 4.0) (%) MeOH (%) Flow rate (ml/min) 0 70 30 1.0 40 0 100 1.0 40.1 0 100 1.2 70 0 100 1.2 Table IV Results of Linearity, LOD, and LOQ for UV Filters No. UV fi lter tR (min) Wavelength (nm) Regression R2 LOD (ppm) LOQ (ppm) 1 PABA 4.48 300 y = 49.10 χ + 0.76 0.9998 0.28 0.85 2 PBS 7.77 300 y = 61.45 χ + 2.98 0.9998 0.21 0.64 3 TDS 15.37 360 y = 65.10 χ − 0.01 0.9997 0.08 0.24 4 BZ-8 26.57 320 y = 16.56 χ + 1.08 0.9998 0.25 0.76 5 BZ-3 30.82 320 y = 18.06 χ + 0.18 0.9999 0.15 0.47 6 IMC 36.26 320 y = 92.91 χ − 0.13 0.9999 0.21 0.63 7 DT 37.06 360 y = 27.08 χ + 2.17 0.9998 0.15 0.47 8 MBC 37.14 320 y = 29.35 χ − 3.08 0.9998 0.21 0.64 9 OC 39.22 320 y = 63.73 χ − 0.77 0.9998 0.23 0.71 10 MA 39.86 360 y = 10.27 χ − 0.39 0.9997 0.25 0.75 11 ED-PABA 40.18 320 y = 71.23 χ − 12.59 0.9996 1.66 5.02 12 BMDM 40.58 360 y = 43.58 χ − 8.87 0.9998 0.58 1.75 13 EMC 40.66 320 y = 52.04 χ + 5.65 0.9998 0.20 0.62 14 DBT 44.90 300 y = 56.29 χ + 2.62 0.9998 0.20 0.62 15 EHT 52.35 300 y = 59.70 χ + 1.68 0.9998 0.18 0.55 16 MBBT 65.47 360 y = 18.25 χ + 5.87 0.9978 1.94 5.89
Purchased for the exclusive use of nofirst nolast (unknown)
From: SCC Media Library & Resource Center (library.scconline.org)