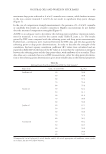
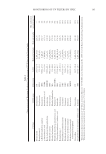
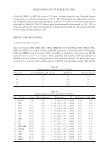
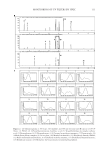
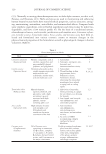
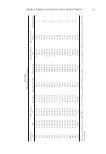
MONITORING OF UV FILTERS BY HPLC 109 a Cap Cell PAK C18 MG2 (4.6 mm × 250 mm, 4.6 μm of particle size, Shiseido, Japan) maintained at a constant temperature of 40°C. The mobile phase was followed by a gradi- ent of MeOH-sodium hydrogen phosphate (pH 4.0 0.01 M) in the volume proportions described in Table III. The UV fi lters were simultaneously determined at 300, 320, or 360 nm, and the detection wavelengths are summarized in Table IV. All analytical results were calculated from triplicate data. RESULTS AND DISCUSSION CHROMATOGRAPHIC ANALYSIS Twelve UV fi lters (MA, MBC, BZ-3, BZ-8, BMDM, OC, ED-PABA, EMC, PABA, IMC, DBT, and TDS) were readily soluble in MeOH to prepare a stock solution of 10000 ppm. EHT and MBBT were dissolved in THF, and PBS was prepared in the mixture of MeOH and 12% acetic acid (1:1, v/v) due to their solubility and stability. DT was prepared in MeOH as a stock solution 1000 ppm due to low solubility. Sixteen UV fi lters were sepa- rated in a C18 column with a mobile phase of MeOH and phosphate buffer. The mobile Table III Gradient Profi le for Analysis of 16 UV Filters Time (min) 0.01 M NaH2PO4 (pH 4.0) (%) MeOH (%) Flow rate (ml/min) 0 70 30 1.0 40 0 100 1.0 40.1 0 100 1.2 70 0 100 1.2 Table IV Results of Linearity, LOD, and LOQ for UV Filters No. UV fi lter tR (min) Wavelength (nm) Regression R2 LOD (ppm) LOQ (ppm) 1 PABA 4.48 300 y = 49.10 χ + 0.76 0.9998 0.28 0.85 2 PBS 7.77 300 y = 61.45 χ + 2.98 0.9998 0.21 0.64 3 TDS 15.37 360 y = 65.10 χ − 0.01 0.9997 0.08 0.24 4 BZ-8 26.57 320 y = 16.56 χ + 1.08 0.9998 0.25 0.76 5 BZ-3 30.82 320 y = 18.06 χ + 0.18 0.9999 0.15 0.47 6 IMC 36.26 320 y = 92.91 χ − 0.13 0.9999 0.21 0.63 7 DT 37.06 360 y = 27.08 χ + 2.17 0.9998 0.15 0.47 8 MBC 37.14 320 y = 29.35 χ − 3.08 0.9998 0.21 0.64 9 OC 39.22 320 y = 63.73 χ − 0.77 0.9998 0.23 0.71 10 MA 39.86 360 y = 10.27 χ − 0.39 0.9997 0.25 0.75 11 ED-PABA 40.18 320 y = 71.23 χ − 12.59 0.9996 1.66 5.02 12 BMDM 40.58 360 y = 43.58 χ − 8.87 0.9998 0.58 1.75 13 EMC 40.66 320 y = 52.04 χ + 5.65 0.9998 0.20 0.62 14 DBT 44.90 300 y = 56.29 χ + 2.62 0.9998 0.20 0.62 15 EHT 52.35 300 y = 59.70 χ + 1.68 0.9998 0.18 0.55 16 MBBT 65.47 360 y = 18.25 χ + 5.87 0.9978 1.94 5.89

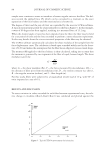
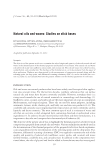
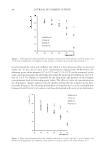
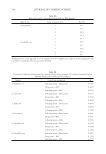
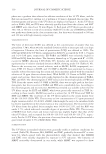
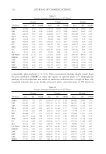
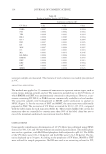
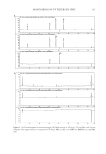
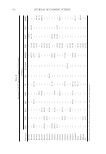
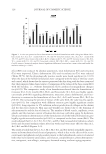
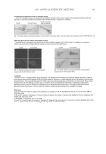
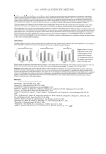
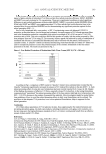
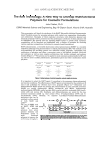
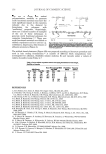
JOURNAL OF COSMETIC SCIENCE 110 phase was a gradient that achieved an effi cient resolution of the 16 UV fi lters, and the fl ow rate increased by 1 ml/min to 1.2 ml/min at 40 min to diminish the run time. The chromatograms and spectra of the UV fi lters are displayed in Figure 1. Acidic UV fi lters such as PABA, PBS, and TDS were relatively quickly eluted from the column, and EHT and MBBT were eluted over 50 min (Figure 2). Each peak of UV fi lters was detected at 300, 320, or 360 nm in view of its intensity (Table IV). In the case of BMDM and EMC, two peaks were shown in the close retention time, but they were determined at 360 nm and 320 nm with high intensity, respectively. VALIDATION STUDY The limit of detection (LOD) was defi ned as the concentration of analyte that was given from 3.3σ/s, where σ is the standard deviation of the y intercepts and s is a slope of regression. Likewise, the limit of quantitation (LOQ) was defi ned as 10σ/s. The LOD and LOQ of the UV fi lters, summarized in Table IV, accounted for 0.08–1.94 ppm and 0.24–5.89 ppm, respectively. ED-PABA and MBBT were relatively higher in LOD and LOQ than the others. The linearity showed up to 50 ppm with R2 0.999, except for MBBT, showing 0.998 (Table IV). Intraday and interday variations were represented as % relative standard deviation (RSD), showing under 5% (Tables V, VI). Prior to the recovery test, several solvents, such as MeOH, EtOH, isopropanol, ace- tone, THF, 2% Tween in EtOH, and 5% DMF in MeOH, were examined to choose a suitable solvent for extracting the cream and lotion matrixes spiked with the standard solution of 20 ppm (data not shown here). With EtOH, 2% Tween in EtOH, isopro- panol, and acetone, there were split peaks displayed in the chromatograms of PABA, PBS, and TDS. The chromatogram of THF extract also showed split peaks of PBS and TDS. From the extract with 5% DMF in MeOH, there was no split peak in the chro- matogram, but the recoveries of PABA and PBS were considerably low. According to the chromatograms and recovery test, MeOH was revealed as a suitable solvent for the UV fi lters except for EHT and MBBT, which were practically extracted in THF. Ac- cording to these results, MeOH was used as a solvent for 14 UV fi lters and THF for EHT and MBBT. The recoveries of the UV fi lters spiked in the cream matrix were 94.98–116.54% (Table VII). The recovery at low concentration of 15 ppm presented slight variation with 1.99–8.02% of RSD, which might be easy to be interfered with by diverse ingredients in the cream matrix at low concentrations. The recoveries of the UV fi lters from the spiked lotion samples were 94.90–116.21%, and the RSD was under 2.7%, which indicated a suitable degree of precision (Table VII). The recovery of MBBT from both cream and lotion matrixes was slightly higher than that of the other UV fi lters, and accounted for 108.09–116.54% and 109.99–116.27%, respec- tively. For the 16 UV fi lters, the precision of recovery from the spiked samples revealed a good result of under 0.5% of RSD (Table VIII). STABILITY STUDY The UV fi lters in standard solution were generally stable at ambient conditions for a week (Table IX). However, MA, BMDM, and EMC gradually decreased R2 as time went by, which agreed with the photostability study that showed that BMDM and EMC were steadily degraded by exposure to UV radiation. The linearity of MBBT noticeably deteriorated in our study, while MBBT was reported to show
Purchased for the exclusive use of nofirst nolast (unknown)
From: SCC Media Library & Resource Center (library.scconline.org)