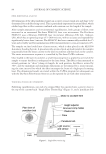
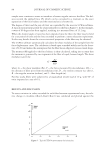
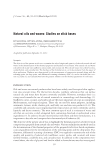
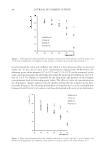
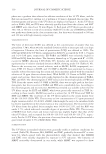
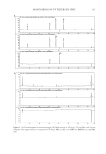
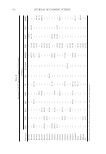
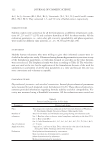
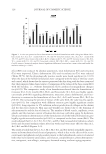
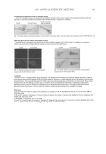
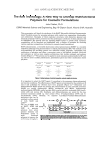
MONITORING OF UV FILTERS BY HPLC 111 Figure 2. (A) Chromatograms at 300 (top), 320 (middle), and 360 nm (bottom) and (B) spectra of 16 UV fi lters: (1) PABA (2) 2-Phenylbenzimidazole-5-sulfonic acid (3) Terephthalylidene dicamphor sulfonic acid (4) Benzophenone-8 (5) Benzophenone-3 (6) Isoamyl p-methoxycinnamate (7) Drometrizole (8) 4-Methylbenzylidene camphor (9) Octocrylene (10) Menthyl anthranilate (11) Ethylhexyl dimethyl PABA (12) Butyl methoxydibenzoylmethane (13) Ethylhexyl methoxycinnamate (14) Diethylhexyl butamidotriazone (15) Ethylhexyl triazone (16) Methylene bis-benzotriazolyl tetramethylbutylphenol.

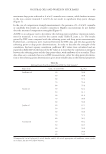
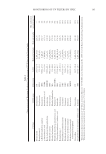
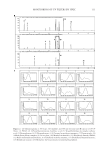
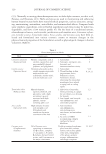
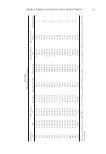
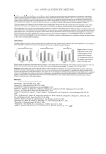
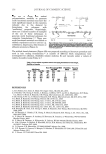
JOURNAL OF COSMETIC SCIENCE 112 Table VI Results of Interday Validation for 16 UV Filters UV fi lters 10 ppm 25 ppm 40 ppm Area SD %RSD Area SD %RSD Area SD %RSD PABA 478.23 7.32 1.53 1234.03 17.15 1.39 1964.42 20.63 1.39 PBS 602.43 7.87 1.31 1551.95 14.72 0.95 2462.31 17.68 0.72 TDS 639.59 7.27 1.14 1643.15 15.29 0.93 2604.33 19.15 0.74 BZ-8 161.29 4.53 2.59 413.52 11.46 2.77 717.38 11.57 1.61 BZ-3 175.05 4.53 2.59 450.76 9.43 2.09 717.38 11.57 1.61 IMC 909.88 6.77 0.74 2334.45 18.91 0.81 3725.85 14.33 0.38 DT 262.57 10.14 3.86 677.07 19.36 2.86 1085.38 7.64 0.70 MBC 278.26 10.40 3.74 724.35 17.06 2.36 1171.21 11.18 0.95 OC 621.38 6.95 1.12 1594.98 16.71 1.05 2557.24 14.69 0.57 MA 101.12 4.34 4.29 262.90 6.98 2.65 408.82 6.17 1.51 ED-PABA 690.38 30.01 4.34 1827.87 85.40 4.67 2863.01 126.87 4.43 BMDM 415.32 5.62 1.35 1084.42 16.59 1.53 1732.05 25.50 1.47 EMC 512.11 8.04 1.57 1315.83 14.69 1.12 2086.57 14.18 0.68 DBT 550.55 11.44 2.08 1420.63 15.36 1.08 2253.72 12.29 0.55 EHT 583.17 8.66 1.49 1504.86 15.14 1.01 2389.47 17.85 0.75 MBBT 177.67 6.35 3.57 468.34 12.57 2.68 721.13 30.59 4.24 Table V Results of Intraday Validation for 16 UV Filters 10 ppm 25 ppm 40 ppm UV fi lters Area SD %RSD Area SD %RSD Area SD %RSD PABA 484.90 6.30 1.30 1240.70 15.98 1.29 1971.09 20.69 1.05 PBS 609.10 5.96 0.98 1558.61 13.33 0.86 2468.97 16.65 0.67 TDS 646.26 6.59 1.02 1649.81 13.77 0.83 2611.00 17.93 0.69 BZ-8 164.62 1.41 0.86 420.19 3.66 0.87 665.53 4.28 0.64 BZ-3 178.38 1.33 0.75 456.09 3.86 0.85 724.05 4.45 0.62 IMC 916.54 4.93 0.54 2341.11 13.27 0.57 3732.52 9.03 0.24 DT 269.24 1.62 0.60 687.07 2.61 0.38 1088.72 2.18 0.20 MBC 284.92 2.05 0.72 734.35 7.19 0.98 1177.87 8.83 0.75 OC 628.05 4.96 0.79 1601.65 15.02 0.94 2563.91 9.01 0.35 MA 99.12 0.96 0.97 259.56 2.68 1.03 412.15 1.99 0.48 ED-PABA 697.46 23.48 3.37 1764.53 43.68 2.48 2803.01 86.88 3.10 BMDM 421.99 8.07 1.91 1091.09 14.86 1.36 1738.72 25.32 1.46 EMC 518.77 4.14 0.80 1322.50 10.67 0.81 2093.24 11.23 0.54 DBT 557.22 1.82 0.33 1427.30 10.61 0.74 2260.39 11.48 0.51 EHT 589.83 4.20 0.71 1511.53 12.19 0.81 2396.14 18.80 0.78 MBBT 182.34 1.97 1.08 475.01 5.54 1.17 722.00 26.20 3.55 comparable photostability (7,17,19). This inconsistent fi nding might result from the poor solubility of MBBT in either the organic or aqueous phase (17). Although the mixture of stock solutions was stable at ambient conditions for a couple of days, the standard solution has to be freshly prepared when concentrations of UV fi lters in
Purchased for the exclusive use of nofirst nolast (unknown)
From: SCC Media Library & Resource Center (library.scconline.org)