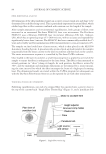
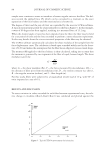
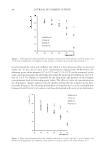
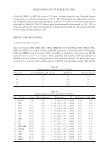
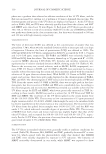
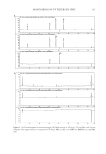
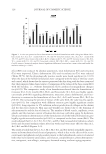
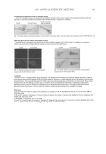
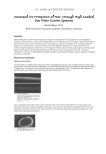
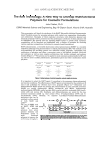
MONITORING OF UV FILTERS BY HPLC 115 Figure 3. (A) Chromatograms of sunscreen sample. (B) Blank matrix at 300 (top), 320 (middle), and 360 nm (bottom). The sample (lotion 3) contains fi ve UV fi lters: PBS (2), BZ-3 (5), MBC (8), BMDM (12), and DBT (14).

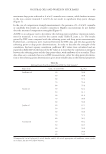
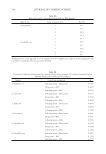
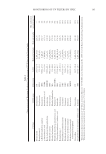
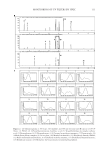
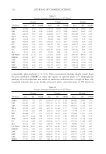
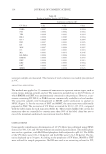
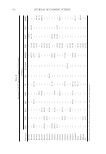
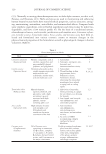
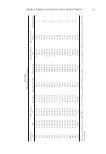
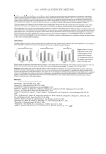
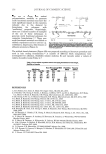
Table X Recovery (%) of UV fi lters in Commercial Sunscreens* UV fi lters Sunscreens PBS TDS BZ-3 IMC MBC OC MA ED-PABA BMDM EMC DBT EHT MBBT Lotion 1 — — — — — — — — — — 92.69 — — Lotion 2 — — — — — — — — 105.79 93.00 106.78 100.55 — Lotion 3 98.65 — — 96.59 — 101.95 — — 125.15 106.39 — — — Lotion 4 — — — — — — — — — 99.35 — — 98.16 Lotion 5 — — — — 98.16 — — — 104.73 — — — 94.79 Lotion 6 — — 91.23 — 100.95 — — — — 98.11 — — 100.64 Lotion 7 105.48 94.35 96.42 — — — — — — 104.74 — — — Lotion 8 — 90.12 — — — — — — — 102.97 — — — Lotion 9 — — 93.80 — — — 90.58 — — 107.23 — — — Cream 1 105.84 — — — — 97.46 — — 105.52 — 106.19 — — Cream 2 109.14 — 92.42 — 91.86 — — — 100.45 — 97.93 — — Cream 3 97.17 — — — — — — — — 98.26 101.50 93.45 — Cream 4 — — — — 106.30 — — — — 103.62 — — 100.67 Cream 5 — 90.53 94.54 — — — — — — 102.20 — — — Cream 6 — 96.34 — — — 95.09 — — 111.64 — — — — Cream 7 — — — — — — — 100.35 — 91.77 — — — Cream 8 — — 90.86 — — — — — — 102.93 — — — Cream 9 — — — 95.69 97.18 100.91 — — 110.58 95.06 — — — Cream 10 — — — — — 97.25 — — 99.14 — — — 101.57 Stick — — — — — 93.17 — — — 98.75 — — — Powder — — — — — — — — — 95.97 — — 98.94 Makeup — 92.37 — — — — — — — 98.03 — — — Oil — 95.01 — — — — — — — 105.34 — — — * Recoveries were calculated on the basis of label claims for each sunscreen. JOURNAL OF COSMETIC SCIENCE 116
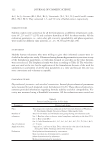
Purchased for the exclusive use of nofirst nolast (unknown)
From: SCC Media Library & Resource Center (library.scconline.org)