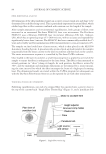
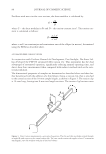
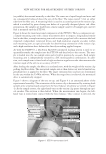
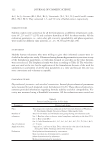
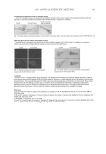
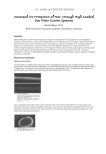
NEW METHOD FOR MEASUREMENT OF FIBER TORSION 87 (or paddles) that extend normally to the fi ber. The vanes are of equal length and mass and are consequently balanced about the axis of the fi ber. The vanes extend 7 mm on either side from the fi ber axis. A mounting block is used to accurately position the torsion clip, which is attached by press-closing two halves of a specially designed plastic tab. After preparation, the samples are loaded into a linear sample cassette (20 samples per cassette) that is mounted onto the FTT950. Figure 4 shows the main functional components of the FTT950. The key components are: a sample mounting arm with a linear micrometer drive to impart a longitudinal tensile load to the fi ber a sample mounting arm with a strain-gauge load cell to measure the load imparted independent rotational drives and high-resolution angular encoders within each mounting arm an optical encoder for determining orientation of the torsion clip and a high-resolution force balance for directly recording applied torques. As with the FDAS765, a Dia-Stron ALS1500 automated loading system is used to se- quentially transfer the samples into the FTT950 and then back to the cassette. The sam- ple is loaded into the two sample arms and is held in position by vacuum. Each sample mounting arm is independently rotated by a DC motor/gearbox combination. In addi- tion, each sample arm is fi tted with a high-resolution angular encoder that measures the rotation angle of the arm to an accuracy of 0.075°. After loading the sample, the fi ber is in a relaxed state, with the weight of the torsion clip pulling the fi ber down. The motorized sample arm is then driven out until a known lon- gitudinal force is applied to the fi ber. The target extension force and rate are determined by the user within the UvWin software. When the target force is achieved, the motorized drive is automatically stopped. Figure 3 shows a diagram of the test set-up, and Figure 4 is an annotated photo of the experimental assembly. The orientation of the torsion clip is determined by rotating both sample arms simultaneously away from the force balance (clockwise as viewed in Figure 4). As the sample rotates, the right-hand vane on the torsion clip passes through an opti- cal encoder. The rotation is then halted. When the measurement run begins, the left- hand vane is rotated into contact with the force balance. Once contact is detected, the Figure 4. FTT950 measurement head.

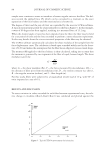
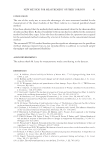
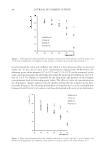
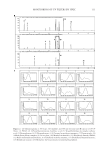
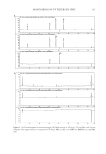
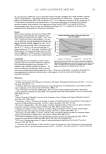
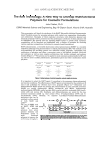
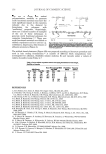
JOURNAL OF COSMETIC SCIENCE 88 sample arms continue to rotate to introduce a known angular twist to the fi ber. The bal- ance records the applied force (F), which can be converted to a moment, as the exact separation of the force balance and the rotational axis is known (L). The degree of twist and the rate of twist are controlled by the user via UvWin software. A typical measurement profi le for a hair/nylon fi ber is shown in Figure 5. In this example, a twist of 90 degrees has been applied, resulting in a measured force of 13.2 mg. When the desired angle of twist has been imparted into the fi ber, the fi ber may be held for a set period of time and the force recorded to perform a stress relaxation experiment. In this way, details about the viscous torsional properties of the fi ber may be obtained. The UvWin software automatically calculates the shear modulus of the sample from the force-displacement curve. The calculation is based upon a method widely used in the litera- ture (29,30) and makes the assumption that the fi ber has an elliptical cross-sectional shape. The moment (M) applied to the force balance is then calculated, taking into account that the moment is generated by two segments of the fi ber of equal, known length. The shear modulus is given by: Frl G D T where G = the shear modulus (Pa), F = the force measured by microbalance (N), r = the distance of fi ber pivot from microbalance (m), D = the torsion constant (see above), θ = the angular rotation (radians), and l = fi ber length (m). For this study, fi bers were subjected to a longitudinal tensile load of 10 g, with 90° of twist imparted at a rate of 6°/s. RESULTS AND DISCUSSION To assess variation in values recorded for each fi ber between experimental runs, the rela- tive change in modulus ((Run2–Run1)/Run1) was calculated and plotted against the Figure 5. Typical FTT950 measurement for hair/nylon.
Purchased for the exclusive use of nofirst nolast (unknown)
From: SCC Media Library & Resource Center (library.scconline.org)