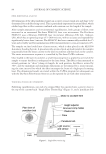
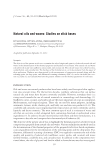
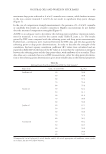
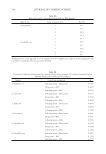
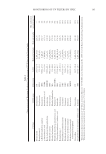
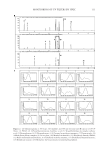
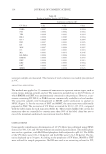
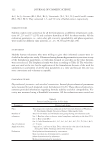
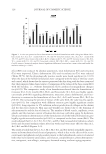
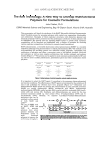
JOURNAL OF COSMETIC SCIENCE 114 sunscreen samples are measured. The mixture of stock solutions was readily precipitated at 4°C. ANALYTICAL APPLICATION The method was applied to 23 commercial sunscreens to represent various types, such as cream, lotion, makeup, powder, and oil. The sunscreens included one to fi ve UV fi lters, of which BMDM and EMC were predominantly contained in the products. However, a sun- screens containing DT, BZ-8, or PABA was not commercially available in a local market. The sunscreen samples were homogenized in MeOH under sonifi cation to analyze in HPLC (Figure 3). For the recovery of EHT and MBBT, the sunscreens were additionally prepared in THF. The recoveries of UV fi lters accounted for 90.12–125.15%, compared with the label claims for each sunscreen (Table X). These results fulfi lled the criteria for sunscreens that are controlled to contain more than 90% of the label claim but not to exceed the maximum authorized concentration listed in Table I. CONCLUSIONS Consequently, simultaneous determination of 16 UV fi lters was performed using HPLC detected at 300, 320, and 360 nm without any analytical predicament. The mobile phase was used as a gradient, with MeOH and phosphate buffer adjusted to pH 4.0. The LODs of the UV fi lters were 0.08–1.94 μg/ml, and the LOQs were 0.24–5.89 μg/ml. The lin- earity displayed up to 50 ppm. According to the properties of UV fi lters, MeOH or THF were utilized for sample preparation. MeOH was used as an extracting solvent for DT, Table IX Results of Stability Test for 16 UV Filters Correlation coeffi cient (R2) UV fi lters 1 day 3 day 6 day PABA 0.9997 0.9994 0.9994 PBS 0.9996 0.9994 0.9994 TDS 0.9996 0.9993 0.9994 BZ-8 0.9996 0.9985 0.9994 BZ-3 0.9996 0.9994 0.9984 IMC 0.9997 0.9994 0.9995 DT 0.9996 0.9993 0.9993 MBC 0.9997 0.9994 0.9992 OC 0.9997 0.9993 0.9994 MA 0.9993 0.9974 0.9946 ED-PABA 0.9996 0.9994 0.9994 BMDM 0.9996 0.9994 0.9930 EMC 0.9996 0.9993 0.9915 DBT 0.9996 0.9993 0.9994 EHT 0.9996 0.9992 0.9993 MBBT 0.9989 0.9456 0.8525

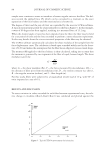
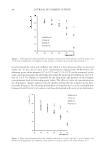
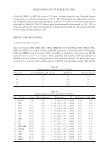
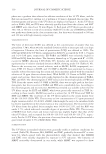
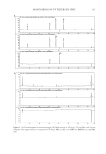
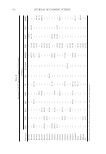
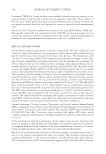
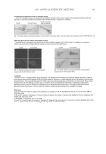
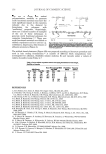
MONITORING OF UV FILTERS BY HPLC 115 Figure 3. (A) Chromatograms of sunscreen sample. (B) Blank matrix at 300 (top), 320 (middle), and 360 nm (bottom). The sample (lotion 3) contains fi ve UV fi lters: PBS (2), BZ-3 (5), MBC (8), BMDM (12), and DBT (14).
Purchased for the exclusive use of nofirst nolast (unknown)
From: SCC Media Library & Resource Center (library.scconline.org)