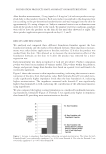
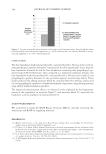
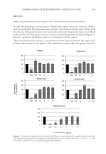
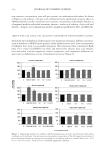
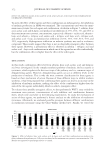
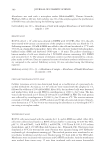
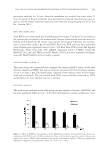
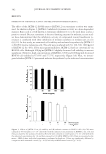
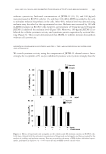
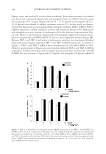
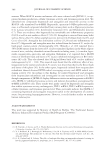
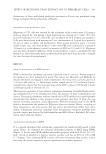
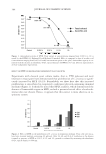
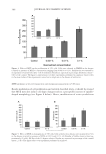
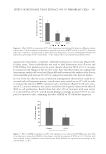
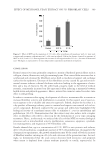
EFFECT OF METHANOL YEAST EXTRACT ON 3T3 FIBROBLAST CELLS 397 organization seems likely a statement confi rmed by fl uorescence microscopy (Figure 8A). In these assays, Texas red-phalloidin was used to label fi lamentous actin (F-actin) and FITC-DNAse I for globular actin (G-actin). Results show that MYE at 0.1% increases F-actin pool at the expense of the one of G-actin. Note that these results are confi rmed by densitometry analysis of F-actin level (Figure 8B) and by western blot analysis of the F-actin triton-insoluble pool (increase of 214% as compared to untreated cells data not shown). In view of the fact that the actin cytoskeleton rearrangement observed here could be as- sociated with cell migration process, scratch assays were carried out on 3T3 cells in order to evaluate the ability of MYE to promote such a mechanism (Figure 9). Of note, mito- mycin C, a mitosis inhibitor, was used to avoid bias that might be related to the effect of MYE on cell proliferation. Results show that, after 24 h of treatment with yeast extract at a concentration of 0.1%, scratch wound healing is strongly increased (473% as com- pared to untreated cells), confi rming the effect of MYE on 3T3 fi broblast migration. Figure 6. Effect of MYE on senescence of 3T3 cells. Senescence was evaluated by detection of β-galactosidase activity after 72 h of incubation in the absence (control) or presence of MYE at 0.01% and 0.1%. Senescent cells were counted by crossing wells in three directions (horizontal, vertical, and diagonal). Results are expressed in percentage of the control (mean ± S.D.). Figure refers to an experiment performed twice. Figure 7. Effect of MYE on apoptosis of 3T3 cells. Apoptosis was evaluated by TUNEL assay after 48 h of incubation in serum-free DMEN in the absence (control) or presence of MYE at 0.1%. Positive cells were counted in four randomly selected microscope fi elds. Results are expressed in percentage of the control (mean ± S.D.).

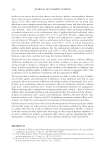
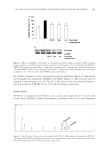
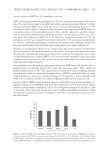
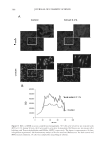
JOURNAL OF COSMETIC SCIENCE 398 Figure 8. Effect of MYE on actin cytoskeleton rearrangement. 3T3 cells were treated or not (control) with MYE at 0.1% during 90 min. (A) F-actin and G-actin were demonstrated by fl uorescence microscopy after labeling with Texas-red-phalloidin and DNAse I-FITC, respectively. The fi gure is representative of three independent experiments. (B) Densitometry analysis of F-actin-associated fl uorescence. For both control and MYE-treated conditions, 10 cells were sampled by using Image J software.
Purchased for the exclusive use of nofirst nolast (unknown)
From: SCC Media Library & Resource Center (library.scconline.org)