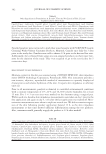
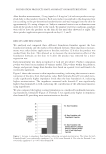
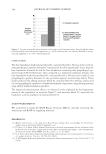
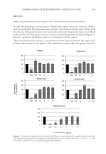
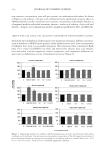
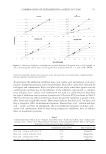
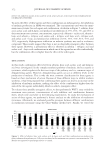
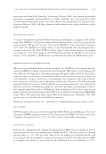
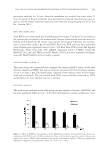
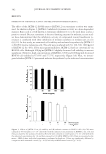
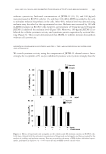
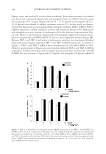
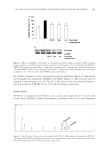
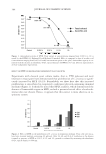
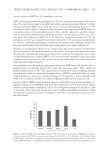
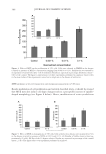
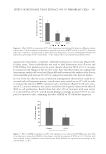
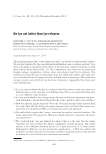
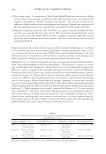
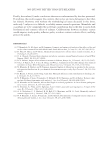
FOUNDATION PRODUCTS HAVE AN IMPACT ON MOISTURIZATION 363 After baseline measurements, 25 mg (equal to 2.8 mg/cm2) of each test product was ap- plied daily to the panelists’ forearms. Each test product was applied to the designated test site according to the pre-determined randomization and was massaged into the skin for approximately 10 s using a fi nger cot. Subjects remained onsite in an acclimation room until all the products were dry to the touch. To simulate real wear conditions, panelists were told to leave the products on the skin all day until they showered at night. The above product application process repeated on days 2, 3, and 4. RESULTS AND DISCUSSION We analyzed and compared three different foundation formulas against the base foundation formula and the marketed benchmark formula. Skin impedance measure- ments were taken before application at baseline and then 12 h after the product was washed from the skin. This allowed us to measure the moisturization effect of the foundation formulas on the skin 12 h after the product was removed for a mini- regression test. Each measurement was taken in triplicate at each site per subject. Product comparison p-value was based on an analysis of variance model. The p values within the products, change, and percent change from baseline were based on a paired t-test and found to be statistically signifi cant. Figure 1 shows the increase in skin impedance reading, indicating the increase in mois- turization of the skin, from the baseline value. Both formulas B and C provided statis- tically signifi cantly higher impedance levels than the base foundation A, indicating higher moisturization. The impedance measured with formula C was signifi cantly higher than formula B as well, indicating the contribution of the additional moistur- izing ingredients. We also compared the highest scoring formulation to a marketed benchmark moisturiz- ing foundation, formula D (Figure 2). Formula C was signifi cantly higher in impedance than formula D, providing more moisturization to the skin. Figure 1. Increase in impedance from baseline, indicating increased moisturization. The values for both Formula B and C were statistically signifi cant (* p 0.05) versus Formula A. The value for Formula C was statistically signifi cant (° p 0.05) versus Formula B.

JOURNAL OF COSMETIC SCIENCE 364 CONCLUSION The base foundation with moisture blend #1, moisture blend #2, Moringa oleifera seed oil, and propylheptyl caprylate (formula C) moisturized the skin signifi cantly better than the base foundation (formula A) and the base foundation containing only propylheptyl cap- rylate (formula B). Furthermore, when compared to a marketed competitor product, the base foundation with moisture blend #1, moisture blend #2, Moringa oleifera seed oil, and propylheptyl caprylate (formula C) also provided superior moisturizing ability. These results indicate that adding moisture blend #1, moisture blend #2, Moringa oleifera seed oil, and propylheptyl caprylate to foundation formulas can promote long-lasting moistur- izing ability within foundation products. The improved moisturization effi cacy we observed can be explained by the hygroscopic nature of the ingredients in moisture blend #1 and moisture blend #2, especially the hyaluronic acid microspheres in moisture blend #2. ACKNOWLEDGMENTS We would like to thank the BASF Beauty Creations IRB for critically reviewing this manuscript and BASF for supplying materials. REFERENCES (1) Mintel, Color Cosmetics – US – July 2012. Mintel Oxygen, 30 July 2012, accessed May 16, 2013, http:// oxygen.mintel.com/display/590605/?highlight=true (2) P. Clarys, A. O. Barel, and B. Gabard, Non-invasive electrical measurements for the evaluation of the hydration state of the skin: Comparison between three conventional instruments - the Corneometer®, the Skicon® and the Nova DPM®, Skin Res. Technol., 5, 14–20 (1999). (3) G. L. Grove, Skin surface hydration changes during a mini regression test as measured in vivo by electri- cal conductivity, Curr. Ther. Res., 52, 556–561 (1992). (4) A. M. Kligman, Regression method for assessing the effi cacy of moisturizers, Cosmet. Toiletries 93, 27–35 (1978). Figure 2. Increase in impedance from baseline, indicating increased moisturization. Even though the values for both products were statistically signifi cant (* p 0.05) versus baseline, the value for Formula C was sta- tistically signifi cant (° p 0.05) versus Formula D.
Purchased for the exclusive use of nofirst nolast (unknown)
From: SCC Media Library & Resource Center (library.scconline.org)