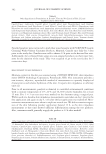
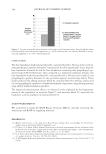
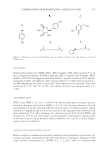
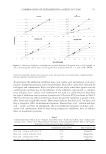
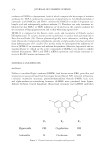
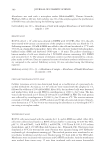
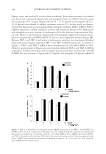
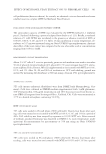
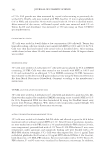
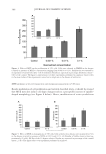
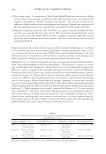
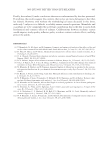
COMBINATION OF DEPIGMENTING AGENTS IN VITRO 367 CELL CULTURE Human skin melanocytes (HSM ATCC, ATCC number: CRL-2208) in passes 8 to 11 were cultured with Dermal Cell Basal Medium (ATCC, Primary Cell Solutions, ATCC Number: PCS-200-030) supplemented with insulin (5 mg/ml), ascorbic acid (50 mg/ml), glutamine (6 mM), epinephrin (1 mM), calcium chloride (1.5 mM), peptide growth fac- tor, M8 supplement, penicillin (10 units/ml), and streptomycin (10 units/ml). They were incubated at 37°C and 5% of CO2 and culture medium was changed every 2 to 3 days. CELL VIABILITY ASSAY WST-1 assay (WST-1, Cat. No. 11 644 807 001, Roche, Mannheim, Germany) was per- formed to determine cell viability. HSMs (1–2 × 10⁵ cells/ml) were cultured in 96-well microplates for 24 h. The next day, different concentrations (1:10 dilutions from 1 mg/ml solution or 5 mg/ml for the less cytotoxic ones) for each compound were added and cells were cultured for 72 h. After treatment, the cells were treated with 10 μl of WST-1 and incubated at 37°C for 4 h. Cell viability was determined by measuring the optical density at 450 nm. Cells in culture medium without inhibitors were used as a control. Experi- ments were run in triplicate. MUSHROOM TYROSINASE KINETICS ANALYSIS Kinetic analysis of mushroom tyrosinase inhibition was performed as previously de- scribed with some modifi cations (24). Fifty microliters of mushroom tyrosinase (1000 units), various concentrations of L -DOPA (0.5, 1, 2, and 3 mM) as a substrate and Figure 1. Chemical structure of (A) hydroquinone, (B) arbutin, (C) kojic acid, (D) azelaic acid, and (E) α-lipoic acid.

JOURNAL OF COSMETIC SCIENCE 368 phosphate-buffered saline (PBS) (pH = 6.8) with or without inhibitor were added to a 96-well plate in a total volume assay of 150 μl. Using a microplate reader, the initial rate of dopachrome formation was determined by the increase of absorbance at 450 nm (OD450/min). Michaelis–Menten constant (Km) and maximal velocity (Vmax) of the ty- rosinase activity were determined by the Lineweaver–Burk’s plot. MEASUREMENT OF CELL-FREE TYROSINASE ACTIVITY Cell-free tyrosinase activity was measured as previously described with some modifi - cations (22). Fifty microliters of L -DOPA 2 mM, 50 μl of mushroom tyrosinase (200 U/ml), and 50 μl of each compound (arbutin 500 μg/ml, kojic acid 10 μg/ml, azelaic acid 100 μg/ml, and α-lipoic acid 50 μg/ml) were added to a 96-well microplate. Everything was dissolved in PBS pH 6.8. After 15 min at 37°C, absorbance at 450 nm was measured to determine the amount of dopachrome produced in the reaction mixture. Sample consisting of L -DOPA and tyrosinase was used as a control. Experi- ments were run in triplicate. Percentage of inhibition was calculated following the formula: % Inhibition = (Asample (450 nm)/Acontrol (450 nm)) × 100 To determine the type of interaction between the agents, dose-effect curves were obtained for each agent and in combination. This data was used to run the CompuSyn software, which uses the method of Chou and Talalay for drug combination analysis (23). Combina- tion index (CI) indicates synergism (1), where the effect of the combination is higher than the sum of the individual effects, additive effect (=1), where the effect of the combi- nation is the sum of the individual effects, or antagonism (1), where the effect of the combination is smaller than the sum of the individual effects. DETERMINATION OF MELANIN CONTENT Melanin content was measured as previously described with some modifi cations (21). HSM (1–2 × 10⁵ cells/ml) were seeded into 6-well culture plates and cultured for 24 h. The next day, cells were added 0.1 mM IBMX and 0.1 μm α-MSH plus the different compounds, each one at their maximum non-cytotoxic concentrations, and incubated for 72 h. After treatment, cells were trypsinized and centrifuged 5 min at 1200 rpm. Mela- nin pellets were dissolved in 200 μl of 1N NaOH at 100°C for 30 min. Absorbance at 405 nm was measured, and the melanin content was calculated against a known standard of synthetic melanin. Experiments were run in triplicate. STATISTICAL ANALYSIS Statistical signifi cance of experimental data was determined by one-way ANOVA/ Dunnett’s multiple comparison test and Student t-test. Differences were considered sta- tistically signifi cant at p 0.05 (*), p 0.01 (**), and p 0.001 (***).
Purchased for the exclusive use of nofirst nolast (unknown)
From: SCC Media Library & Resource Center (library.scconline.org)