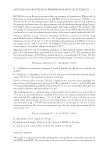
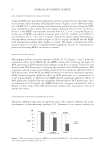
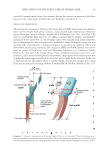
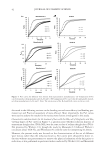
JOURNAL OF COSMETIC SCIENCE 42 discussed in the following sections on the bending set and wave effi cacy (see Bending per- manent set and Practical assessment of wave effi cacy). Most importantly, the Pa/t curves were used to analyze the results for the various wave lotions investigated in this study. Characteristic reduction kinetics for the treatment of hair with the NH4 salt of thioglycolic acid. Re- viewing shapes of Pa/t curves in Figure 5, a question arose whether reduction kinetics of ammonium thioglycolate (TGA-NH4) was the same as that of sodium thioglycolate (TGA- Na) presented by Wickett (11), though the study by Manuszak (12) followed Wickett’s conclusion about TGA-Na, and Wortmann (4) cited the same for interpreting his theory. However, the present study was focused on the characterization of the set of different wave lotions rather than the reduction kinetics, Pa/t curves were obtained for direct re- duction without any pretreatment to remove the physical relaxation of the hair prior to reduction, as was performed in previous studies conducted by Wickett (11) and Manuszak Figure 5. Pa/t curves for different wave lotions from representative manufacturers. (A) Comparison of Pa/t curves for products from manufacturers A, B, and C. (B) Comparison of Pa/t curves for the same grades of prod- ucts from manufacturers A, B, and C. Note: The intersection of the B–S and B–N curves in (A) (see text).

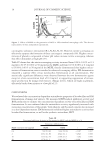
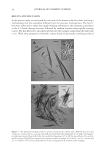
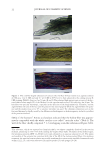
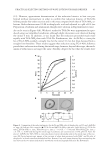
PRACTICAL SELECTING METHOD OF WAVE LOTION FOR HAIR DRESSER 43 (12). However, approximate determination of the reduction kinetics in hair was per- formed without pretreatment in order to confi rm that reduction kinetics of TGA-Na follows pseudo fi rst-order reaction and in this way compared with that of TGA-NH4 so- lutions. Both solutions were 0.6 M in thioglycolic acid and adjusted to a pH of 8.6 (see Preparation of sodium and ammonium thioglycolate solution in Experimental section). As can be seen in Figure 6(A), Wickett’s results for TGA-Na were approximately repro- duced using our simplifi ed conditions, although slight deviations were observed during the initial 6 min. In addition, it was found that the reduction proceeded much more rapidly with TGA-NH4 than with TGA-Na. Furthermore, the -ln (Ft/Fo) vs. time plot for of TGA-NH4 yielded a straight line for the initial 10 min but then deviated from a straight line thereafter. These results suggest that reduction using TGA-NH4 follows a pseudo fi rst-order reaction during the initial stage however, beyond this stage, the mech- anism of reduction is no longer the same. Notably, despite the fact that the results were Figure 6. Comparison of the reduction kinetics for the Na and NH4 salts of thioglycolic acid: Pa and –ln(Ft/Fo) vs. time. (A) Left axis: Pa/t curves for (▲) TGA–Na and ( )TGA–NH4 right axis: –ln(Ft/Fo) for ( ) TGA–Na and ()TGA–NH4 vs. time TGA–Na ( ) vs. time: y = 0.036X , r = 0.992 and TGA–NH4()vs. time: y = 0.13X, r = 0.989 only during the initial stage. Conditions salt concentration: 0.6 M pH: 8.6. Note: the plot of –ln(Ft/Fo) for TGA–NH4 vs. time also shows a linear relationship only in the initial stage of the reac- tion. (B) Optical microscopic images of the sections of white hair pretreated with NH4+ and Na salts of thioglycolic acid and stained with methylene blue. Bottom: Gray-scale image obtained by scanning along the line between the two points indicated by arrowheads on the micrographs (taken by Dr. Kawamura).
Purchased for the exclusive use of nofirst nolast (unknown)
From: SCC Media Library & Resource Center (library.scconline.org)