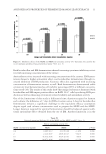
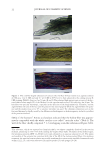
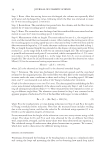
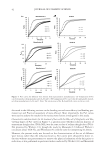
JOURNAL OF COSMETIC SCIENCE 40 Homogeneity of the hair fi ber microstructure. Wortmann reported that the disagreement be- tween the So and Sℓ values was signifi cant and assumed that it was due to inhomogeneity of the radial distribution of the modulus in the hair fi ber. He confi rmed this assumption by performing a bending test independent of the extensional test (10). Because of the good agreement of the So and Sℓ values in the present study, the inhomogeneity of the radial distribution of the modulus in the hair fi bers as proposed by Wortmann were not considered in the present study. Characterization of the wave lotions. The set of a permanent wave is governed mainly by the reduction process, which is determined by the characteristics of the given wave lotion. In Japan, wave lotions have been qualitatively characterized by their strength in wave molding of the hair: S (strong), N (neutral), and W (weak). As a result, it is impossible to objectively assess the differences in the holding characteristics of wave lotions produced by different manufacturers. The use of Pa/t curves resolves this problem, because the curves illustrate the progress of reduction with time, and the differences in the various waving lotions can be identifi ed by comparing the corresponding curves. Figure 5 shows the Pa/t curves for the wave lotions listed in Table I, with parts presenting the curves for the waving lotions produced by manufacturers A, B, and C, respectively. Table II Extensional Permanent Waving Set Exp No Sample t (min) Pa (%) Ere (%) Ero (%) ℓ(mm) ℓ(m) Sm(%) So(%) 1 A–S 16.7 90.5 3.8 58.2 69.0 65.7 95.2 93.5 2 A–N 15.2 79.9 15.5 79.1 67.5 54.8 81.2 80.4 3 A–W 16.2 67.7 29.8 83.0 67.8 44.3 65.3 64.1 4 B–S 17.2 88.1 4.7 61.7 69.0 65.2 94.5 92.4 5 B–N 15.2 82.2 11.2 75.1 68.4 58.6 85.7 85.1 6 B–W 19.2 72.7 23.6 82.6 68.5 49.6 72.4 71.4 7 C–S 17.3 85.6 8.8 71.2 68.4 59.0 86.3 87.6 8 C–N 16.1 58.5 38.8 85.3 67.9 37.0 54.7 54.5 9 C–W 14.3 40.9 56.5 83.6 67.8 22.1 32.6 32.4 10 A–N 1.3 21.2 75.2 91.3 68.6 10.6 15.5 17.6 11 A–N 2.6 29.3 66.3 90.6 67.9 16.7 24.6 26.8 11 A–N 3.5 42.5 53.0 87.7 67.9 25.0 36.8 39.6 12 A–N 4.3 40.0 54.3 86.0 67.3 24.3 36.1 36.9 13 A–N 5.0 45.3 48.6 85.4 66.5 27.4 41.2 43.1 14 A–N 6.0 64.9 29.6 82.8 67.5 42.7 63.3 64.3 15 A–N 7.5 67.1 28.7 83.4 67.4 43.3 64.2 65.6 16 A–N 9.0 72.4 22.4 82.3 68.4 48.0 70.2 72.8 17 A–N 10.2 60.0 36.4 84.9 67.4 38.2 56.8 57.1 18 A–N 11.8 70.2 26.7 82.5 67.8 45.8 67.6 67.6 t (min), reduction time (see step 2 in Fig. 2) Pa (%), apparent progress of reduction (see equation (2) and step 2 in Fig. 2) Ere (%) normalized residual stress after reoxidation (see step 5 in Fig. 2) Ero (%) normalized Young’s modulus after reoxidation (see step 7 in Fig. 2) ℓ (mm) extended length measured on recording paper (see step 6 in Fig. 2) Δℓ (mm), set length measured on recording paper, (see step 6 in Fig. 2) Sℓ, observed set [see equation (1)] So, calculated set using equation (5).

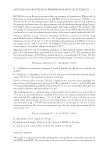
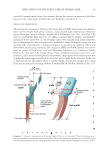
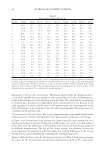
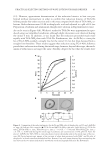
PRACTICAL SELECTING METHOD OF WAVE LOTION FOR HAIR DRESSER 41 The holding strengths (S, N, and W) of the lotions from each manufacturer agreed well with the order of the corresponding Pa values obtained at 15 min. If the user applies wave lotions produced only by one manufacturer, the Pa/t curves may not be signifi cant, be- cause the order of the holding strengths (S, N, and W) agreed with the Pa values obtained at 15 min, and they are not necessary for selecting a particular wave lotion. However, without the Pa/t, the characteristic behavior of B–N, would not be detected, i.e., intersec- tion of B–N and B–S [see Manufacturer B in Figure 5(A)]. In addition, comparison of the behavior of wave lotions of the same strength (S, N, or W) from different manufacturers is not possible when only on the basis of the indication of S, N, or W on the package. In these cases, Pa/t curves provide helpful information, as can be seen in Figure 5(B). The differences in the curves were found to be signifi cant (p value 0.05) as determined using a two-way layout analysis of the variance for six repeated test results for each lotion. Therefore, for practical purposes, an indication of the strength of the wave lotion (S, N, or W) as a numeric expression, such as the Pa value at 5 min taken from the Pa/t curve (see Practical assessment of wave effi cacy for an explanation of the use of 5 min) is desired. However, in order to provide Pa values at 5 min that can be compared, a standard appa- ratus and method for determining the Pa/t curves of permanent waving lotions is needed. Note that the intersection of the B–S and B–N curves shown in Figure 5(A) can only be detected by plotting the Pa/t curves. In this case, the Pa values for the B–N lotion were greater than those of the B–S lotion at a short reduction time (5 min) and less than those of the B–S lotion at a long reduction time (15 min). This reversal of the reduction behavior is Figure 4. Relationship between the observed set (Sℓ) and the calculated set (So) obtained using equation (5). The letter for each plot indicates the sample name (see Table I) (■), (▲), and (●) indicate the applied reduc- tion times shown in Exp. Nos.1–9 in Table II. A–N applied for the various reduction times are listed in Exp. Nos. 10-18 in Table II. Correlation: y = 1.00X, r = 0.997. Note: Linear viscoelasticity about set in exten- sional permanent treatment.
Purchased for the exclusive use of nofirst nolast (unknown)
From: SCC Media Library & Resource Center (library.scconline.org)