JOURNAL OF COSMETIC SCIENCE 58 sirtuins can contribute to the longevity of many organisms by silencing genes during times of nutritional deprivation (9), they may also increase cell survival after UV-induced stress using the same mechanisms. In a previous report (4), we described the effects of low levels of UVB radiation on sirt3 expression and its inverse relationship to sirt4 expression in normal human epidermal keratinocytes ( NHEK). We further demonstrated how UVB can disrupt the normal activity and cycle of expression of sirtuins, both of which appear necessary for maintaining cutaneous health. In this report, we expand these fi ndings to include sirt1 and sirt6 and correlate these results with the effects of UVB on H2O2 and energy metabolism. Our objective was to determine the relative levels of expression of sirt1, sirt3, and sirt6 over time in NHEK synchronized by starvation. Additionally, we determined sirtuin expression after UVB irradiation. If the patterns of sirtuin expression were similar, this might imply a generalized response by sirtuins to environmental challenge that might also be related to ATP levels and reactive oxygen species (ROS). MATERIALS AND METHODS CELL CULTURE NHEK were obtained from a commercial supplier (Cascade Biologics, Portland, OR) and cultured according to the manufacturer’s recommendations at 37°C in a 5% CO2 hu- midifi ed incubator. Cells were incubated in EpiLife medium (Cascade) without any h u- man keratinocyte growth supplement (HKGS Cascade) during starvation. The supplement included bovine pituitary extract, human epidermal growth factor, hydrocor- tizone, insulin, and transferrin. Cells were released from starvation by incubating cells in full EpiLife medium with HKGS. CELL VIABILITY Cell toxicity was determined with an Alamar Blue solution (Invitrogen, Carlsbad, CA), which was prepared at 10% in cell media and added to cells for 2 hours. After incubation, cellular fl uorescence (Ex535nm/Em612nm) was measured in a SpectraMax Gemini fl uores- cence plate reader (Molecular Devices, Sunnyvale, CA). A decrease in fl uorescence is indicative of cytotoxicity. UV RADIATION Cells were irradiated before being released from starvation. Cells were washed with Dulbecco’s modifi ed phosphate-buffered saline, pH 7.4 (D-PBS), covered with a thin layer of D-PBS (3 ml in a 100 mm plate) and then irradiated with FS40 UVB bulbs (Philips Fisher Scientifi c, Pittsburgh, PA) through a Kodacel fi lter (Kodak, Rochester, NY). UVB fl uences were measured with an IL1400A radiometer (International Light, Newburyport, MA).

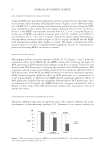
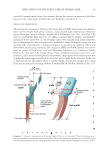
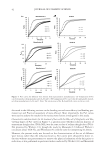
SIRTUIN EXPRESSION AS A FUNCTION OF TIME AND UVB IN EPIDERMAL KERATINOCYTES 59 RNA EXTRACTION AND QUANTIFICATION NHEK were plated in 100 mm plates at 5 × 10⁵ cells per dish. After treatments were completed, RNA was extracted from cells using a QIAshredder tube (Qiagen, Valencia, CA) in conjunction with the RNeasy mini kit (Qiagen) as per the manufacturer’s instruc- tions. RNA was then quantifi ed by measuring its absorbance at 260 nm with a DU7500 spectrophotometer (Beckman, Fullerton, CA). R EVERSE TRANSCRIPTION AND REAL-T IME POLYMERASE CHAIN REACTION RNA was reverse transcribed using a High Capacity cDNA Archive Kit from Applied Biosystems, Inc. (ABI, Foster City, CA), as per the manufacturer’s instructions. Real-time polymerase chain reaction (RT-PCR) was employed using the 2X TaqMan Fast Universal PCR Master Mix (ABI) in conjunction with a 20X TaqMan Gene Expression Assay Mix (ABI), which consists of human primers and probes for Sirt1 (ABI P/V Hs01009005_ m1), Sirt3 (ABI P/N Hs00202030_m1), Sirt4 (ABI P/N Hs01015516_g1), Sirt6 (ABI P/V Hs00966002_m1), and the endogenous control, glyceraldehyde-3-phosphate dehy- drogenase (G APDH, ABI P/N Hs99999905_m1). Primers and probes were designed to span exon–exon junctions to ensure amplifi cation of only the transcribed gene of interest and not any residual genomic DNA that might have been present. Relative gene expres- sion (change in expression of target gene normalized to an endogenous control (GAPDH) and relative to a reference group (untreated cells)) of real-time RT-PCR data was calcu- lated using the 2 −ΔΔCT method. ATP/H2O2 DETERMINATION NHEK were grown in 96-well black clear bottom plates at 3 × 10⁵ cells per plate. Cells were starved, released from starvation, and irradiated as described above. ATP was mea- sured with a luminescence-based assay, ATP Lite (Perkin Elmer, Waltham, MA), according to the manufacturer’s instructions. Luminescence was measured on an Lmax luminometer (Molecular Devices). H2O2 was measured with a method using CM-H2DCFDA (Invitrogen, Eugene, OR). Fifty micrograms of CM-H2DCFDA was dissolved in 100 μl ethanol and then a 1:100 working dilution of the CM-H2DCFDA/ethanol solu- tion was prepared in D-PBS. Cells were incubated with the working dilution at 37°C for 20 min. Then an equal amount of 25 mM NaN3 in D-PBS was added directly to the working dilution and incubated for another 2 h at 37°C. Fluorescence was measured at 485 nm/530 nm (excitation/emission) with a Spectra Max Gemini EM (Molecular Devices) (10). RESULTS NHEK were synchronized by serum supplement deprivation for 15 hours followed by repletion in full media to follow the cycle of sirtuins under normal conditions. Samples were then harvested at 0, 2, 4, 6, and 8 h and RNA extracted and analyzed by real-t ime RT-PCR. These results are illustrated in Figure 1a and show that sirt1, 3, and 6 follow the
Purchased for the exclusive use of nofirst nolast (unknown)
From: SCC Media Library & Resource Center (library.scconline.org)