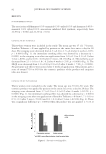
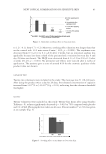
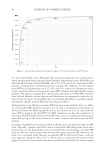
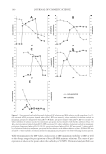
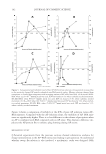
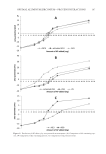
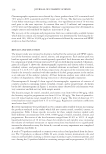
JOURNAL OF COSMETIC SCIENCE 88 (5), and Australia/NZ versus FDA-FM. The statistical analysis for the correlation be- tween International versus Australia/New Zealand, International versus FDA-FM, and Australia/New Zealand versus FDA-FM, were 0.94, 0.99, and 0.95, respectively, illus- trating a strong positive correlation between each pair. The difference in least squares mean SPF for each method pair was 0.12, 0.62, and 0.81, respectively, showing no statis- tically signifi cant differences between the mean SPFs obtained using the different testing methods. The authors concluded that “the procedure discrepancies in FDA-FM, Australia/ New Zealand Method, and the International Method are inconsequential either the dif- ferences have no impact on mean SPF value, or, less likely, the differences produce equally and opposite changes in mean SPF, thus cancelling any effects.” Although there is no difference in mean SPF from the various methods, there is a differ- ence in the label SPF, which the consumer sees to make a determination of purchase. In the United States, the FDA regulations dictate the subtraction of an A value from the mean SPF to generate the label SPF. The FDA regulations are the only regulations in which the label SPF differs from the mean SPF. Thus, special consideration must be given when SPF testing for the United States or for other countries that will accept the FDA method. In testing a formulation for sunscreen effi cacy, the fi rst step is to choose an expected SPF value. Typically, a product brief will contain a target label SPF along with several other characteristics of the fi nal product. For successful product development, the label SPF must be achieved, which begins with choosing the correct expected SPF. Several factors need to be considered when choosing an expected SPF for the United States, with the most important being the A factor (5–7). The A value is composed of the product of the upper 5% point of the one-tailed t-distribution and the SD, divided by (n), where n equals Figure 1. Relationship between percentage blockage of UV-induced erythema and SPF value.

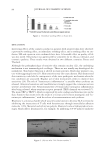
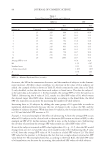
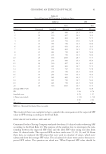
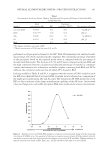
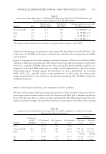
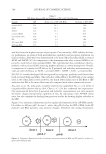
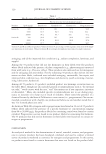
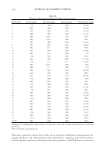
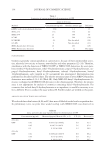
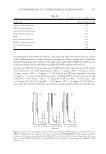
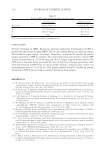
CHOOSING AN EXPECTED SPF VALUE 89 the number of subjects. The label SPF is the largest whole number after subtracting A from the average SPF. Thus, the average SPF from the clinical trial must be suffi ciently large to still meet the target label SPF after the A value has been subtracted. Historical data of A values have been used to evaluate the chances at 70%, 80%, 90%, and 100% of passing a target label SPF of 15, 20, 30, or 50. Using the results of the analysis herein, one can choose an expected SPF that has a known chance of passing the target label SPF. MATERIALS AND METHODS The methods used to determine these percentage increases involved studying clinical trial data (not shown). With the information provided from those trials, sample SDs were es- timated and collaborated to give sample data, which could be used in the calculation of the percentage increase. With that data, sample A values were calculated. A is calculated by multiplying the SD by the critical value on the t-distribution chart at an α level of 0.05, and dividing by the square root of the number of subjects. The 10 calculated A values were examined and the minimum, maximum, and mean were used for further calculations. Using these values, different percent increases were applied to the SPF val- ues to determine what percentage of the clinical trials would pass the intended label SPF value. To determine the actual percent increases, the percent passing was applied to the formula. For example, for SPF 15, the A value to provide 70% passing was 1.32. There- fore, to obtain a label SPF value of 15, the expected SPF value must be at least 16.32, so the subtraction of the A value still results in an SPF of 15. A percentage increase of 8.8% yields this result. This method was continued to fi nd all necessary percentage increases. RESULTS AND DISCUSSION A VALUE AFFECTS THE LABEL SPF Unlike other methods, the FDA-FM (5) method and the more recently published FDA Proposed Amendment (6) and FDA Final Rule methods (7) subtract an A value from the mean SPF to calculate the label SPF value. The A value is composed of the product of the upper 5% point of the one-tailed t-value and the SD divided by n, where n equals the number of subjects. This subtraction decreases the average SPF determined by the FDA-FM and FDA Final Rule methods to the label SPF value, which is the largest integer after subtraction. While product briefs frequently seek an SPF with a 5 or 0 at the end, (e.g., 15, 20, 30, etc.) delivering a formulation with the requested label SPF can be diffi cult due to the variable experimental value of A. There are two examples that exhibit this variability. Example 1. An example of the effect of subtracting A from the average SPF is shown in Table I, where the target label SPF was 50. In this example, the average SPF obtained from the 10 subjects is 52.8. However, subtracting the A value of 4.04 results in a label SPF value of 48, below the target label SPF value of 50. The A value is dependent on three numbers, one-tailed t-value, SD, and number of subjects. As SPF data from more subjects are added, the one-tailed t-value in the numerator
Purchased for the exclusive use of nofirst nolast (unknown)
From: SCC Media Library & Resource Center (library.scconline.org)