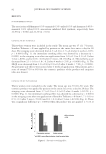
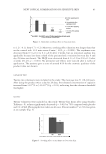
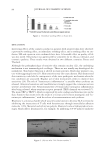
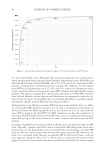
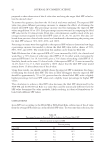
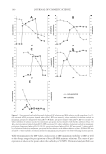
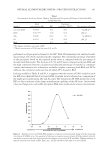
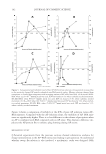
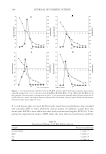
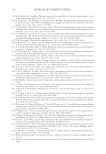
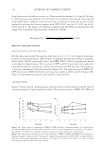
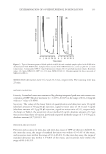
JOURNAL OF COSMETIC SCIENCE 104 pH. The starting mixtures were prepared according to the molar ratios at the IEP of each AP–BSA solution as demonstrated previously. ζ-Potential and turbidity measurements were performed as the pH is adjusted to the range of 3 to 11. The ζ-Potential and turbid- ity of all solutions varied as pH changed. Figure 6 represents the turbidity of ACH–BSA Figure 4. Comparison of maximum turbidity at IEP of pure AP solutions with AP–BSA mixture solutions. The turbidity of all solutions was measured after the dilution of 15 times. Figure 5. Amount of AP actives added as a function of BSA concentration. BSA solutions with fi ve different concentrations (1, 5, 10, 20, and 40 mg/ml) were used. The amount of AP actives required to neutralize BSA increased the same as the ratio increases in the concentration of BSA solutions resulting in a constant value of AP/BSA ratio. Activated ACH, ZAG, Al13, and ZG had same behavior under this study.

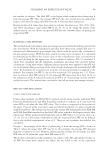
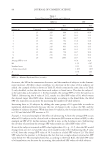
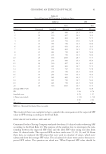
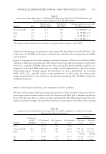
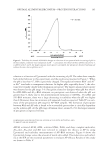
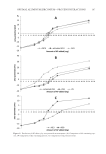
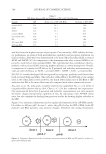
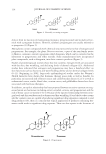
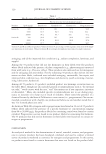
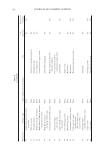
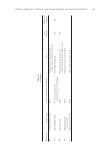
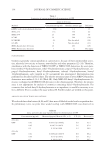
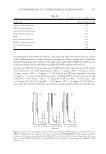
OPTIMAL ALUMINUM/ZIRCONIUM—PROTEIN INTERACTIONS 105 solution as a function of ζ-potential with the increasing of pH. The other three samples had similar behavior in this experiment, and the results are presented in Figure 7. When the pH is less than 4.7, BSA is positively charged. The repulsion between BSA+ and Al3+ or Zn4+ ions leads to transparent solutions. At higher pHs, especially above 5, the solu- tions were visually cloudy with voluminous precipitate. The largest amount of precipitate was observed at the pH range 5–6. Precipitate started to dissipate when pH was over 8. In ACH–BSA and Al13–BSA solutions, no precipitate was observed when the pH was greater than 9, likely due to the aforementioned formation of Al(OH)4-. For ZAG and ZG–BSA mixtures, there was a large decreasing in turbidity when the pH was higher than 8. However, these two mixtures still appeared cloudy as expected. Table IV is a sum- mary of the precipitation pH range for AP–BSA samples. The formation of precipitate between BSA and AP salts is found to be a reversible process that is critically dependent on the solution pH. At the pH range of human sweat, around 6, (36) the largest amount of precipitate is expected to form. COMPARISON AND PREDICTION OF AP EFFICACY BY ZETA POTENTIAL AND TURBIDITY MEASUREMENTS ASCH, activated ACH, ACH, activated ZAG, ZAG, and three complex molecules, Al13-mer, Al30-mer and ZG were selected to compare the effi cacy as AP by using ζ-potential and turbidity measurements of AP–BSA mixtures. Figure 8 shows the ζ-potential change versus the amount of metal salts added. The molar ratio and turbid- ity at the IEP are two essential parameters to evaluate AP effi cacy. Results of this study are shown in Table V. Figure 6. Turbidity of activated ACH-BSA changes as a function of zeta potential with increasing of pH. In all four samples, solutions were transparent at pH = 3, precipitate was observed when pH was raised over 4, at pH between 5 and 6, the largest amount of precipitate was formed, the precipitate dissolved and mixture solution became clear as pH was over 7.
Purchased for the exclusive use of nofirst nolast (unknown)
From: SCC Media Library & Resource Center (library.scconline.org)