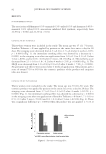
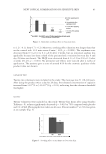
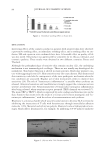
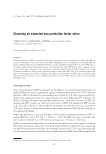
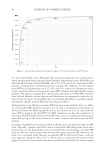
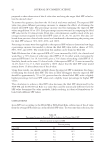
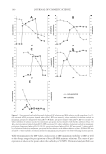
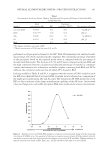
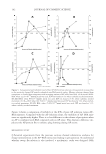
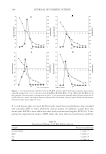
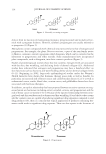
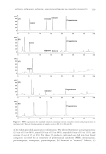
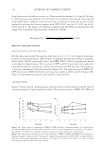
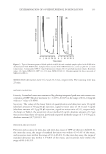
JOURNAL OF COSMETIC SCIENCE 102 Figure 4 shows a comparison of turbidity at the IEPs of pure AP solutions versus AP– BSA mixtures. Compared with the AP solutions alone, the turbidity of AP–BSA mix- tures are signifi cantly higher. There is a clear difference in the volume of precipitate when an AP is combined with BSA compared with an AP alone. This dramatic difference im- plicates the AP/protein fl oc to enhance plug forming during AP action. MECHANISTIC STUDY ζ-Potential experiments from the previous sections showed substantive evidence for charge neutralization in the AP–BSA interaction leading to precipitation. To understand whether sweep fl occulation is also involved, a mechanistic study was designed: BSA Figure 3. Zeta potential and turbidity trend of four AP-BSA mixture solutions. Zeta potential increased due to the positively charged AP particles adsorbed onto BSA particle surface. Mixture solutions changed from transparent to cloudy then transparent with increasing amount of AP added into BSA. (A) Activated ACH- BSA: when 4 122.4 10 mmole × metal was used, IEP was found at 5.65, where turbidity reached maximum. (B) ZAG-BSA: when 4 85 10 mmole × metal was used, IEP was found at 5.60, where turbidity reached maximum. (C) Al13-BSA: when 4 162.79 10 mmole × metal was used, IEP was found at 5.62, where turbid- ity reached maximum. (D) ZG–BSA: when 4 25.95 10 mmol × metal was used, IEP was found at 5.15, where turbidity reached maximum.

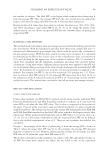
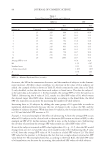
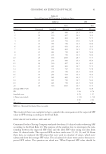
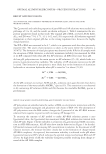
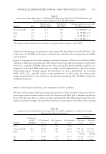
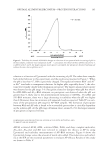
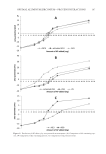
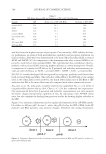
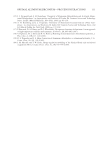
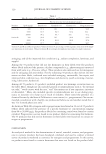
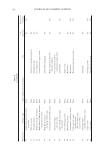
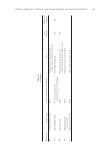
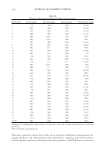
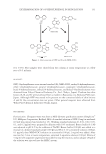
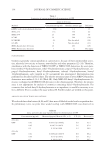
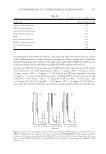
OPTIMAL ALUMINUM/ZIRCONIUM—PROTEIN INTERACTIONS 103 solutions with varying concentrations were titrated by the addition of solid AP salts. The molar ratio of AP–BSA at the point of maximum turbidity was measured for each BSA concentration. Figure 5 demonstrates the relationship between the amount of AP actives added and BSA solution in different concentrations. The linearity indicates that precipitation is governed solely by a constant AP/BSA molar ratio. Since sweep fl occulation would entail the en- trapment of multiple BSA molecules in a single metal hydroxide fl oc, this clean linear relationship argues strongly against the dominance of such a mechanism. As activated ACH, ZAG, Al13, and ZG all have same performance in this study we surmise that charge neutralization is the dominant mechanism regulating the AP–BSA interaction and plug formation. EFFECT OF PH ON ZETA POTENTIAL AND TURBIDITY OF AP–BSA COMPLEX We have demonstrated that ζ-potential measurements can be used to evaluate the forma- tion of precipitate between various AP salt solutions and BSA. pH is another signifi cant factor (39) that has effect on these systems, undoubtedly. The following studies were de- signed to provide insight into how the formation of precipitate was affected by varying Table II Isoelectronic Point, Molar Ratio of AP/BSA at IEP, Maximum Turbidity of AP–BSA Mixtures, and Precipitation Dosage Range for Four AP–BSA Samples Samples IEP* Molar ratio at IEP (AP–BSA) Turbidity at IEP (NTU) Dosage range for precipitation* (AP–BSA molar ratio) Activated ACH 5.60 24:1 549 b b 14 AP/BSA 62 ZAG 5.65 8:1 392 b b17 5 AP/BSA Al13 5.6 4:1 525 b b 3 AP/BSA 7 ZG 5.10 1.5:1 390 b b 0.5 AP/BSA 3 *The dosage range is determined at the molar ratio where turbidity is greater than 50NTU. Table III Comparison of Calculated Metal Percentage (w/w) in AP–BSA Complexes to the Metal Percentage Obtained from Elemental Analysis Samples Molar ratio at IEP (AP/BSA) %C Obtained (w/w) %H Obtained (w/w) %N Obtained (w/w) %Metal(s) Calculated (w/w) Obtained (w/w) BSA - 50.75 7.28 15.28 - - Activated ACH 24:1 49.20 7.09 14.42 1.65, Al 1.62, Al ZAG 8:1 49.15 7.08 14.23 0.97, Al 0.92, Zr 0.92, Al 0.88, Zr Al13 4:1 49.08 7.12 14.43 1.79, Al 1.57, Al ZG 1.5:1 49.86 7.13 14.67 1.27, Zr 1.70, Zr
Purchased for the exclusive use of nofirst nolast (unknown)
From: SCC Media Library & Resource Center (library.scconline.org)