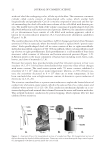
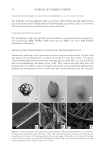
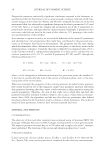
JOURNAL OF COSMETIC SCIENCE 4 appropriate weight. The epoxy cures slowly at room temperature. After 24 h of curing, the epoxy containing the embedded hair fi ber was taken out of the cylinder and cut into ~2 mm thick sections perpendicular to the longitudinal axis of the hair fi ber. A standard metallography polishing technique was to use to polish the epoxy until a clean cross- sectional interface of hair was obtained. AFM images of the hair cross section were ac- quired using a Multimode Nanoscope IIId supplied by Bruker Corporation (Billerica, MA) at ambient conditions (22°C, 50% humidity) in the contact mode. A sharp nitride lever probe combining a sharp silicon tip with a silicon nitride cantilever was used for the topographic imaging acquisition. The nominal radius of the tip was about 2 nm and the spring constant of the cantilever is 0.06 N/m. A scan rate of 2 Hz was used for all mea- surements. The data collection was set to both the height and defl ection channels. OPTICAL MICROSCOPY Images of the hair surface were collected in the refl ected light microscopy mode using an Olympus BX50 (Olympus America, Center Valley, PA) optical microscope equipped with 10× (UMPlanFL 10×/0.30), 20× (LMPlanFL 20×/0.40), 50× (LMPlanFL 50×/0.50), and 100× (LMPlanFLN 100×/0.80) objectives. Equipped with a 10× eyepiece and an addi- tional 2× objective, magnifi cations of roughly 200×, 400×, 1000×, and 2000× were obtained in the fi nal images. The microscope also contains a motorized z-stage allowing z-stacks to be generated. Each fi nal image was obtained by generating an image stack and then using an algorithm to combine in focus details in each image of the stack into one fi nal image. DYNAMIC CONTACT ANGLE ANALYSIS An Attension tensiometer was used to determine contact angle (Biolin Scientifi c, Stockholm, Sweden). A single hair fi ber, cut to approximately 1 cm near the root, was immersed approximately 3 mm into deionized water and the advancing contact angle was mea- sured. The required hair diameters were measured using a handheld micrometer. Ten fi bers in each hair tress were measured. DIFFERENTIAL SCANNING CALORIMETRY A Q2000 differential scanning calorimeter (TA Instruments, New Castle, DE) was employed using pressure resistant, high volume stainless steel pans. Samples consisted of 8–12 mg of cut (2–5 mm) hair fi bers, along with roughly 55 (±1.5) mg of deionized water. Each pan was sealed and allowed to sit for at least 6 h at room temperature to ensure equilib- rium water content and distribution within the hair fi bers. Heating at a rate of 2°C/min was performed from 22° to 190°C in standard mode. Three repetitions per lot were con- ducted. TA Universal Analysis 2000 (TA Instruments, New Castle, DE) was used in conjunction with Windows 4.7A (Microsoft Corporation, Redmond, WA) to determine the denaturation temperature (Td) and enthalpy of denaturation (ΔH). RESULTS AND DISCUSSION To gain more insight into the dye leaching process, we utilized a dissolution apparatus and monitored the amount of dye leached from hair as a function of rinse time. We studied both pigmented and nonpigmented hair to understand the contribution of melanin dis- solution to the dye leaching process. Experiments were carried out using a hair dye based

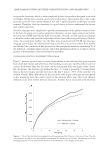
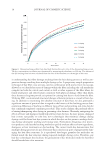
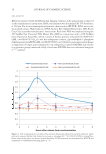
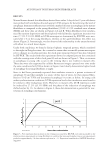
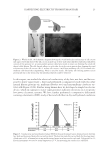
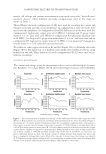
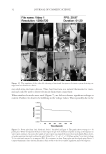
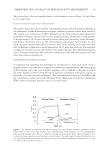
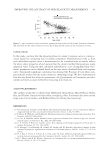
HAIR DAMAGE DURING MULTIPLE OXIDATIVE DYEING AND SHAMPOOING 5 on pyrazole chemistry, which is often employed in hair dye products designed to provide red shades. Of the dyes currently used in the market place, the pyrazole dye in this study provides one of the most intense shades of red, and is especially prone to shampoo or water removal. Therefore, this dye chemistry is a good choice to better understand the factors that control color loss. Several techniques were employed to provide measurements of the physicochemical state of the hair, focusing on its surface properties (dynamic contact angle analysis) and ultra- fi ne structure (AFM and refl ected light microscopy). Overall, we fi nd signifi cant damage in both the surface and internal components of hair due to bleaching and dyeing. Further- more, dye penetration profi les into the fi ber were monitored with FT-IR spectroscopic imaging, providing a two-dimensional map across the cross section of hair. And, fi nally, we followed the condition of hair proteins in the amorphous matrix by measuring Td of the α-helical, crystalline phase proteins. All of this information allows us to depict a better picture of how synthetic dyes leach from the hair fi ber. DYE LEACHING KINETICS OF DIFFERENT TYPES OF HAIR Figure 1 presents typical kinetics curves corresponding to dye leaching that were acquired from dyed dark brown and white hair. Dye leaching occurs once dyed hair fi bers come in contact with water. Hair dye loss rates can be determined from the slopes of the curves. By calculation, the dye loss rate within the fi rst ~3–5 min is generally 5–8 times faster than in the later stages, and the dye loss in the fi rst 3 min is ~35% of the total dye loss (within 30 min). More than likely, the dye loss in the early stages of this process corresponds to dye migration from the cuticle region to the solution phase since this is the shortest diffusion route from within the hair structure. Another factor associated with relatively Figure 1. Plots of leached dye from pigmented and nonpigmented hair fi bers as a function of time. The dye concentration in solution was determined by measuring the absorbance at 490 nm. The amount of the dye leaching from hair was calculated from the ratio of the absorbance to the weight of hair tress.
Purchased for the exclusive use of nofirst nolast (unknown)
From: SCC Media Library & Resource Center (library.scconline.org)