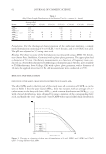
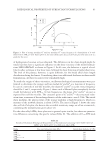
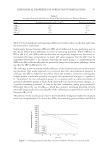
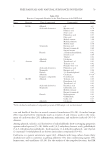
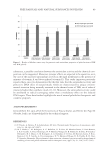
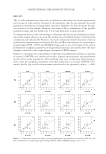
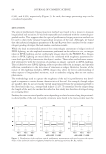
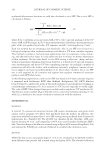
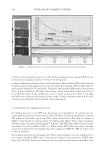
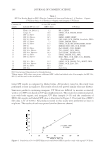
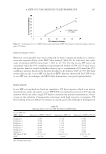
JOURNAL OF COSMETIC SCIENCE 108 spreading. Alternatively, the EBT3 fi lm method requires a specifi ed area to measure SPF value, and the reproducibility of data should be signifi cantly increased. It is worth noting that both European Cosmetic and Perfumery Association (Colipa) and U.S. Food and Drug Administration (FDA) required UV irradiation for in vitro UVA test. In 2011, the FDA published a fi nal rule including a method to determine the critical wave- length which requires a fi xed preirradiation dose of 4 MEDs (8 J/cm2). For the area of EBT3 fi lm (5.1 × 6.3 cm), the four MEDs dose is about 257 J which is close to the dose 237.12 J used in this study. However, all current SPF/UVA tests are instant measurement by UV spectrometer after preirradiation. Sunscreens with different UV degradation pattern might have the same SPF/UVA results. For example, two sunscreens will degrade 50% after 30 min under UV irradiation. The fi rst sunscreen degrades 50% instantly after the fi rst 5 min, whereas the other degrades gradually to 50% after 30 min. Both sunscreens will have the same in vitro SPF value with current irradiation method, but they will have differ- ent in vivo SPF value. Alternatively, the new SPF method based on EBT3 fi lm should give similar SPF because it is also based on cumulative UV dose response like in vivo SPF test. CONCLUSIONS A new in vitro SPF test method based on UV dose cumulate response was proposed. The new method utilizes Gafchromic EBT3 fi lm in lieu of UV spectrophotometers. Based on in vitro SPF results from 17 commercial products, the EBT3 fi lm method is accurate and cost-effective. The EBT3 fi lm method has almost half the COV of in vivo SPF tests, indi- cating that this new method has very good reproducibility. Like other in vitro SPF meth- ods, the new method can be improved by optimizing test parameters, such as sunscreen amount, irradiation time, and EBT3 fi lm, provided reproducibility is maintained. This technology could also be used in UV light source and sample application uniformity check, sunscreen photostability check, etc. ACKNOWLEDGMENTS The authors would like to thank Michael Shi (Ashland Inc.) and Shelley Shih (Ashland Inc.) for providing Gafchromic fi lm, and Linda Foltis (Ashland Inc.) for valuable discussions. REFERENCES (1) M. Pissavini and L. Ferrero, In vitro determination of sun protection factor, Glob Cosmet Manuf., 4, 1–5 (2004). (2) D. Lutz and N. Cariou, Accurate, fast and quite easy way of sunscreen testing. Compliant with in vitro global standard: COLIPA, BOOTS, FDA & ISO, H&PC Sun Care, 3, 25–29 (2011). (3) L. Ferrero, M. Pissavini, A. Dehais, S. Marguerie, and L. Zastrow, Importance of substrate roughness for in vitro sun protection assessment, IFSCC Magazine, 9(2), 97–108 (2006). (4) O. Dueva-Koganov and N. Shaath, Comparative evaluation of commercial SPF 100+ sunscreen prod- ucts, Happi, 47, 48–53 (2010). (5) V. Borca, M. Pasquino, G. Russo, P. Grosso , D. Cante, P. Sciacero, G. Girelli, M. R. La Porta, and S. Tofani, Dosimetric characterization and use of Gafchromic EBT3 fi lm for IMRT dose verifi cation, J. Appl. Clin. Med. Phys., 14(2), 158–170 (2013). (6) E. Butson, T. Cheung, P. Yu, and M. Buston, Measuring solar UV radiation with EBT radiochromic fi lm, Phys. Med. Biol., 55, 487–493 (2010).

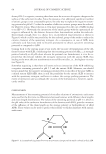
J. Cosmet. Sci., 67, 109–110 (March/April 2016) 109 Letter to the editor The Entrance Echo corresponds to Epidermis on High Frequency Skin Ultrasound XIMENA WORTSMAN, Departments of Radiology and Dermatology, Institute for Diagnostic Imaging and Research of the Skin and Soft Tissues, Clinica Servet, Faculty of Medicine, University of Chile, Las Condes, Santiago, Chile I have read with great interest the article “The top echorich band in a 50-MHz ultrasound sonogram refl ects epidermal properties” (1). I congratulate the authors for their work that demonstrates that the entrance echo, also called entry echo, (i.e., hyperechoic layer on top of the dermis) on ultrasound indeed corresponds to the epidermis. This has been an old and long discussion among the operators of high-frequency probes that has created a deep confusion in the literature. We have arrived to the same conclusion by comparing the ultrasound images of patients with psoriasis (2) that present sonographic thickening of the epidermis and patients with cutaneous ulcers that show absence of the epidermis at the site of the ulcer on ultrasound, which has been also correlated with histology (3). Moreover, the normal epidermis presents regional differences that can be detected on ul- trasound (4,5). Thus, the epidermis in the plantar and palmar regions (glabrous skin) is thicker than the epidermis located in the nonglabrous skin (out of the palms and soles) because of their higher content of keratin in the stratum corneum. Hence, the epidermis appears as a bilaminar hyperechoic layer in the glabrous skin and as a monolaminar hy- perechoic layer in nonglabrous skin. Again, these sonographic fi ndings also match with the histological fi ndings (4). Therefore, I fully agree with the authors that the entrance echo is not just an artifact and that it corresponds to the epidermis, and consequently, this layer can vary in its sono- graphic representation according to the site of the body and the physiopathological pro- cesses that may affect it. REFERENCES (1) D. Qu and S. Whitehead. The top echorich band in a 50-MHz ultrasound sonogram refl ects epidermal properties. J. Cosmet. Sci., 66, 285–293 (2015). Address all correspondence to Ximena Wortsman at xworts@yahoo.com
Purchased for the exclusive use of nofirst nolast (unknown)
From: SCC Media Library & Resource Center (library.scconline.org)