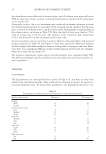
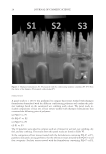
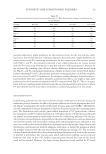
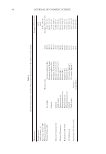
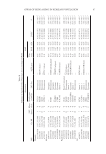
JOURNAL OF COSMETIC SCIENCE 10 this formulation were edible and of natural origin, and all of them were approved by the FDA for their use in food, cosmetic, and drug formulation as reported in the subsequent in vivo results (30). Demographic analysis . An in vivo assessment was conducted on human volunteers to assess the general sensorial properties and safety of the obtained natural emulgel. For this pur- pose, a total of 20 volunteers were enrolled in the study. Demographic and physiological skin characteristics are shown in Table VII. More than half of them were females (72%) with an average age of 18–30 years. The majority of the volunteers had normal skin (52%), and about 60% of the volunteers had fair skin color. General organoleptic and sensorial properties analysis . Based on the organoleptic and sensorial analyses presented in Table VI and Figure 4, there were signifi cant differences between the LG emulgel and blank emulgel in terms of cooling effect, astringent, and odor. More- over, there was a signifi cant difference in the overall evaluation between the two emulgels, where the p-value was less than 0.05. The means of organoleptic characteristics of both emulgels were compared (Table VII). The LG-based emulgel could be suitable for skin moisturization and overall suitable cos- metic properties. ANALYSIS Q-PARAMETERS The Q-parameters are developed by the scientist Di Qu et al. and have recently been added in the calculation formula. They could only be obtained in mode 1 for equal suc- tion and relaxation time. To obtain these parameters, two horizontal lines have to be Table VI Demographics and Physiological Skin Characteristics of the Study Population Baseline characteristic Frequency Percentage (%) Gender Male 14 28 Female 36 72 Socioeconomic status Low 0 0 Middle 35 70 High 15 30 Skin type Normal 26 52 Oily 7 14 Dry 17 34 Skin color Light 13 26 Fair 30 60 Dark 7 14 Skin sensitivity Yes 2 4 No 48 96

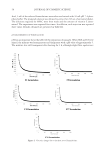
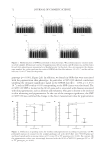
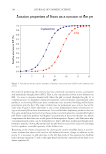
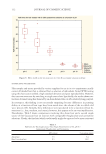
EMULGEL FORMULATION AND IN VITRO AND IN VIVO ASSESSMENT 11 spread at the graph—the fi rst one spreads through the highest point (R0) and the second one spreads through the infl exion point, that is, the point in time at which the recovery curve deviates from its initial linearity. At this point, QE and QR are divided (Figure 5). The Q-parameters include the following parameters (see Figures 6 and 7): 1. Q0 = The maximum recovery area, that is, the area under the highest point (R0). 2. QE = The elastic recovery area of the skin. 3. QV = The viscous recovery area of the skin. The parameters calculated by Cutometer Software include the following: 1. Q0 = Q0 the maximum recovery area, that is, the area under the highest point (R0). 2. Q1 = QE/Q0 the elastic recovery of the skin. 3. Q2 = Q2 = QV/Q0 the viscous recovery of the skin. 4. Q3 = (QE + QV)/Q0 the total viscoelastic recovery of the skin, that is, overall skin elasticity. R-PARAMETERS The following additional parameters are calculated by software: 1. R1 = Uf–Ua, the residual deformation at the end of the fi rst measuring cycle (resilient distension). 2. R2 = Ua/Uf, the ratio of total retraction to total deformation, which is called gross elasticity of the skin (viscous deformation). Figure 4. Organoleptic characteristics of two studied emulgel formulations.
Purchased for the exclusive use of nofirst nolast (unknown)
From: SCC Media Library & Resource Center (library.scconline.org)