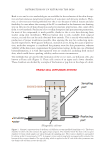
added, and the digestion mixture was incubated overnight at 37°C in the presence of 10% acetonitrile to facilitate enzyme access. The dried digests were resuspended in 50 μL 0.1% formic acid and further diluted 40 times before injection on the mass spectrometer. LC-MS/MS All samples w ere analyzed in triplicate on an Ultimate 3000 UPLC system (Thermo Scientifi c, Waltham, MA) coupled to a maXis Impact HD mass spectrometer via a CaptiveSpray source equipped with a nanoBooster device (Bruker Daltonik, Bremen, Germany). For each sample, 1 μL of the sample was loaded on a C18 PepMap100 nano-Trap column (300 μm ID × 5 mm, 5 micron, 100 Å) (Thermo Scientifi c) at a fl ow rate of 3 μL/min. The trap column was then switched in line with the analytical ProntoSIL C18AQ column (100 μm ID × 150 mm, 3 micron, 200 Å). The reverse phase elution gradient was from 2% to 20% to 45% B over 60 minutes, totaling 84 minutes at a fl ow rate of 600 nL/min. Solvent A was LCMS-grade water with 0.1% formic acid solvent B was LCMS-grade acetonitrile with 0.1% formic acid. To profi le quantitative protein expression patterns, the LC-MS analysis of the samples was performed in positive ion mode, with a mass range between 130 and 2,200 m/z and a sampling rate of 2 Hz. To link the expression levels with identifi cations, a pool of all curly and a pool of all straight samples was created, and triplicate LC-MS/MS runs of these pools were performed using data-dependent acquisition with the following settings: the same LC parameters as described before, a full scan MS spectrum, with a mass range of 50–2,500 m/z, was followed by a maximum of 10 collision-induced dissociation tandem mass spectra (350–1,500 m/z) at a sampling rate of 2 Hz for MS scans and 1–20 Hz for MS/MS (depending on precursor intensity). Precursors with charges 2+ and 3+ were preferred for further fragmentation, and a dynamic exclusion of 60 seconds was set. Following the LC-MS run , the Q-TOF data were analyzed with Compass DataAnalysis 4.4 software (Bruker Daltonics) to evaluate the LC chromatogram and the overall quality of both MS and MS/MS spectra. From each triplicate sample run, the two LC-MS runs of highest quality were chosen to be included in the quantitative analysis. Protein Identifi cation The Peaks X Studio soft ware package (Bio informatic Solutions Inc., Waterloo, ON, Canada) was used to analyze the LC-MS/MS data. The raw data were refi ned by a built-in algorithm, including only ions with a charge 2+ to 5+ and allowing chimeric spectra. The proteins and peptides were identifi ed with the following parameters: a precursor mass error tolerance of 10 ppm and fragment mass error tolerance of 0.05 Da were allowed, the UniProt human database (v2018.07 173,324 sequences) was used, semi-trypsin was specifi ed as digestive enzyme, and up to two missed cleavages were allowed. Carbamidomethylation of cysteine was set as a fi xed modifi cation. Oxidation (M) and deamidation (NQ) were chosen as vari- able modifi cations for the Peaks DB search, and in the optimized Peaks posttranslational modifi cation (PTM) search, pyro-Glu from Q and carbamylation (C) were added to the variable modifi cation list. A maximum of three PTMs per sample were permitted. False discovery rate (FDR) estimation was made based on decoy fusion. An FDR of 1% at the peptide-spectrum match level (associated with a peptide score threshold of -10 log p 22) and a peptide PTM A-score of 50 and a protein -10lgP score 20 were considered adequate for confi dent peptide and protein identifi cation. At least one unique peptide per protein is required for both identifi cation and quantifi cation purposes. JOURNAL OF COSMETIC SCIENCE 252

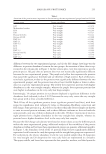
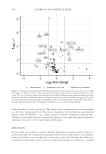
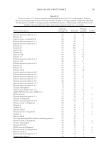
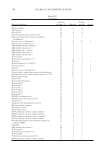
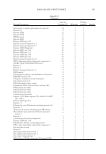
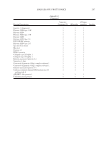
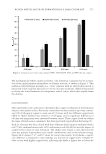
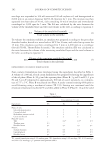
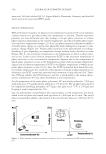
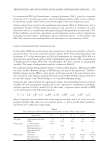
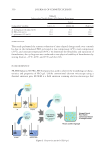
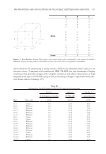
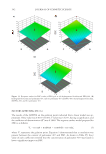
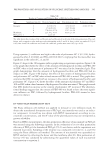
Label-Free Quantifi cation To quantify the protein e xpression levels, label-free quantifi cation (LFQ) was per- formed using Peaks Studio X software. Here, expression levels between the 20 curly (duplicate LC-MS runs of 10 samples) and 20 straight samples were compared. The following parameters were set: a mass tolerance error of 10 ppm and a retention time (RT) shift tolerance of 2 minutes were allowed. To determine the relative protein abundances in the LC RT-aligned samples, peptide feature–based quantifi cation was performed. Comparison of the relative levels of each protein identifi ed in the samples was based on the LC peak areas of up to three unique peptides per protein that were automatically selected by the software. A further manual inspection of each of the selected unique peptides was performed, and the top three best unique peptide can- didates were selected for LFQ abundance estimations. Statistical analysis To a ssess whether protein s were expressed in different amounts between the curly and the straight hair groups, protein area values were compared between the curly and straight groups using a Welch t-test, followed by Benjamini–Hochberg correction for the p values. A p value d 0.05 was considered as statistically signifi cant. Protein area values were screened before the means comparison so that only those observed in at least 75% of samples in either the curly or the straight hair group were compared between the groups. This screening excluded protein area values not consistently observed in both groups from analysis, to ensure that comparison of the groups was only made on reliable protein area values. All statistical analyses were carried out with statistical software R (version 4.0.0). Data visualization Partial least square-discri minant analysis (PLS-DA) plots were generated with the mixOmics package (19), volcano plots with the EnhancedVolcano package (version 1.7.2, https:// github.com/kevinblighe/EnhancedVolcano), and expression abundance plots using ggplot. All graphs were generated using R (version 4.0.0). RESULTS In this study, prot eomic te chnologies were applied to determine whether differences in protein abundance could be observed between the very straight hair samples and the very curly hair samples. To achieve this goal and to minimize the effect of biological variance between individuals, pools of fi ve curly or fi ve straight hair samples of our batch were created. Ten very curly pooled samples (named sample A to sample J) and 10 very straight pooled hair samples (sample K to sample T) were used for further analysis. Proteomic analysis was performed on a high-resolution mass spectrometer instrument, and state-of- the-art data analysis tools were applied, to maximize the number of identifi ed peptide sequences and thus protein identifi cations. Overall, 362 proteins were be identifi ed across all samples, with 217 confi dent protein identifi cations that were detected and quantifi ed in at least 75% of all samples. To ensure rigorous statistical analysis, further analysis was only based on the 217 proteins that were detected and quantifi ed in most samples. An overview of these proteins is provided in Appendix 1. HAIR SHAPE PROTEOMICS 253
Purchased for the exclusive use of nofirst nolast (unknown)
From: SCC Media Library & Resource Center (library.scconline.org)