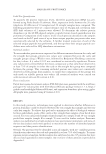
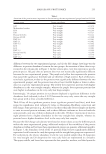
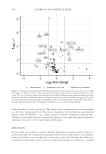
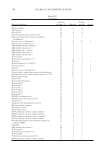
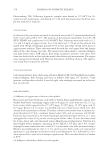
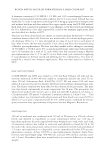
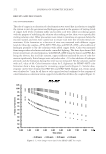
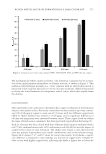
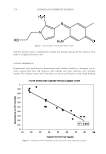
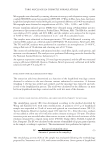
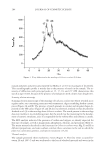
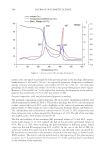
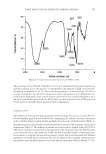
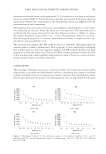
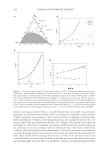
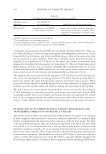
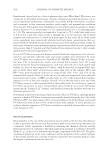
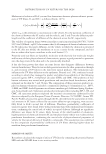
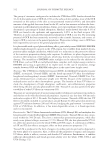
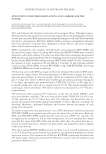
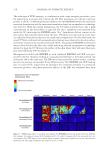
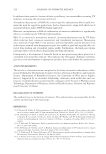
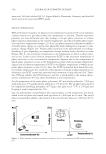
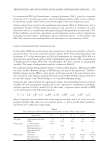
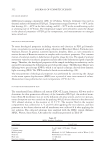
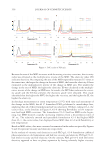
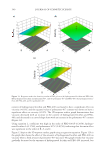
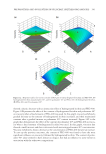
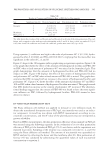
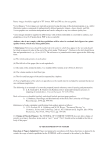
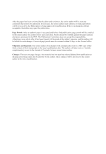
of the abundance levels, respectively. The larger these rectangular boxes in each boxplot are, the more variation between the protein abundance levels within an experimental group is seen. For KAP4-7, e.g., a large variation of protein abundances between indi- viduals was seen within the very curly group, whereas a very tight distribution of protein abundances was seen in the straight hair sample group. DISCUSSION In this study, we sought to explore whether differences could be found at the pro- teome level when we compared two groups of human hair shafts with a very different grade of curliness: very straight hair versus very curly hair. Because hair fi bers are considered to have large intra- and inter-sample phenotypical variabilities, a pooled Figure 2. Volcano plot representing the differential abundancies of proteins in very curly versus very straight hair samples is observed. On the x-axis, the log2 fold change of each protein is represented, whereas on the y-axis, the -log10(p-value) is shown. Proteins that have a high fold change and a signifi cant difference in the abundance level with an adjusted p value are of high interest these proteins are labeled in the graph. The yellow dots on the left represent proteins higher in abundance in the very straight samples, whereas the purple dots on the right represent proteins that were higher in abundance in very curly hair shape samples. JOURNAL OF COSMETIC SCIENCE 256

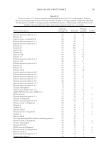
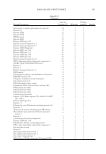
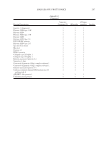
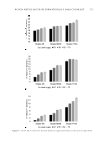
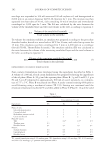
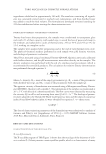
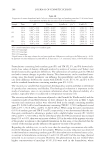
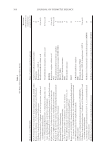
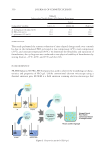
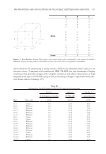
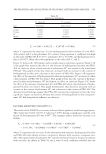
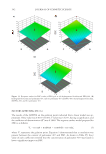
strategy was adopted, whereby each sample consisted of a pool of fi ve individuals. Thus, from the 50 individual samples available from each experimental group, 10 pools were created. Each pool was measured in duplicate to evaluate consistency of the protein profi le within and between pools. Table II List of proteins showing differences in abundance between very curly versus very straight hair samples. The proteins in the list have a signifi cant p value of p 0.05 (which is corrected for multiple testing via Benjamini–Hochberg) and a fold change of at least 2 (log2 fold change = 1) Protein Fold change (very curly/very straight) Adjusted p value Full protein description SBP1 −1.181081415 1.13E-06 Methanethiol oxidase K34 −2.066207146 2.04E-06 Keratin 34 KAP 13-2 1.634917291 9.42E-05 Keratin-associated protein 13-2 KAP 4-4 2.68765369 0.000198 Keratin-associated protein 4-4 KAP 9-8 −1.2927477 0.000288 Keratin-associated protein 9-8 K10 2.010710525 0.000362 Keratin 10 KAP 4-2 −1.112588238 0.000362 Keratin-associated protein 4-2 K38 1.271281473 0.000362 Keratin 38 K1 1.484219137 0.000514 Keratin 1 KAP 4-7 −1.414189772 0.000514 Keratin-associated protein 4-7 K2 1.567179628 0.005741 Keratin 2 ATL3 −2.161080371 0.007585 ADAMTS-like protein 3 K40 −1.129873144 0.028445 Keratin 40 K81 −1.153647498 0.011886 Keratin 81 Figure 3. Abundance levels of the 14 proteins found to be signifi cantly different between the two hair types. The upper, middle, and lower lines represent the fi rst quantiles, medians, and third quantiles of the abundance levels, respectively. HAIR SHAPE PROTEOMICS 257
Purchased for the exclusive use of nofirst nolast (unknown)
From: SCC Media Library & Resource Center (library.scconline.org)