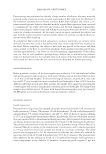
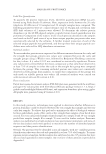
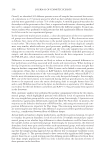
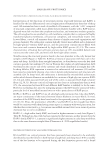
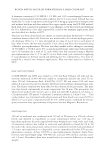
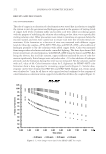
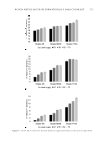
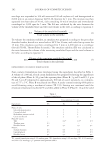
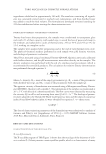
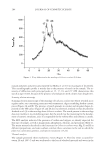
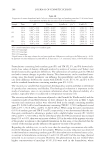
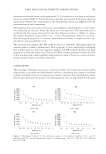
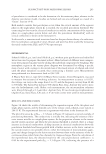
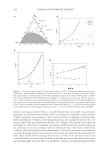
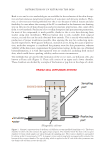
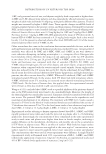
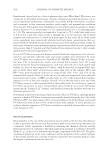
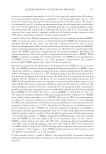
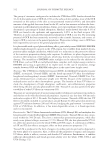
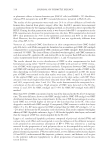
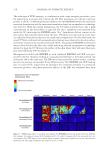
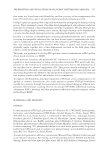
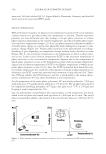
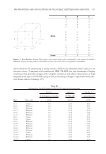
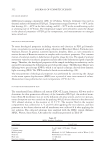
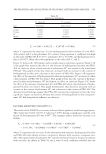
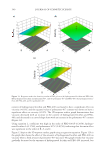
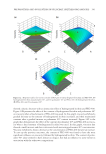
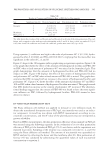
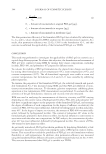
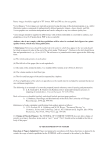
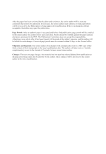
These fi ndings imply that viscosity has more signifi cant infl uence on formulation stabil- ity at low temperature than elasticity. RSM RES ULT Table V shows the data for response variables by independent variables according to the experimental design used in this study. Analysis of variance (ANOVA) was used in determin- ing the most appropriate response surface model for the effect of independent variables. Using this response surface model, the changes in response variables including viscosity, elasticity, and DSC (mW/mg) at a gelation point of –10°C were estimated by the concen- trations of poloxamer 407, hydrogenated lecithin, and PEG-400 as independent variables. Table VI represents an adequate model according to the results of the ANOVA. Interactive coeffi cients and p values represent the effect of independent variables on response variables in the model. The 3D response surface graphs (Figures 11–13) are used in interpreting the Figure 8. Visco-elasticity results of PLO gels. Figure 9. Viscosity results of PLO gels. PREPARATION AND EVALUATION OF PLURONIC LECITHIN ORGANOGELS 337

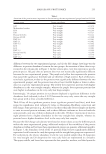
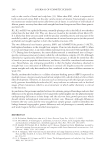
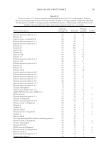
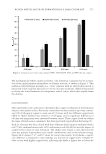
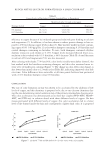
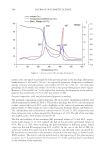
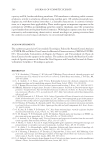
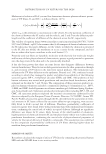
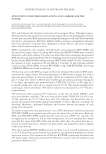
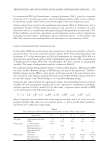
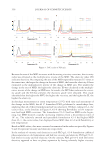
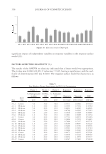
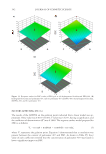
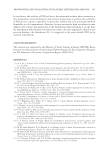
signifi cant impact of independent variables on response variables in the response surface model (33). FACTORS AFFECTING ELASTICITY (Y1) The resu lts of the ANOVA on elasticity indicated that a linear model was appropriate. The p value was 0.0040 ( 0.05) F value was 7.3545, having a signifi cance and the coef- fi cient of determination (R2) was 0.6292. The response surface model for elasticity is as follows: Figure 10. Elasticity results of PLO gels. Table V Box-Behnken Design Experiments for PLO Gel Optimization Run Space type Factor 1 Factor 2 Factor 3 Response 1 Response 2 Response 3 A: Hydrogenated lecithin B: PEG- 400 C: Poloxamer 407 Elasticity Viscosity DSC wt% wt% wt% EI (1/nm2) MVI (1/nm2) mW/mg #2–1 Center 3.0 20.0 20.0 0.3511 0.6300 0.53319 #2–2 IB factor 1.0 25.0 20.0 0.1555 0.7539 0.47859 #2–3 IB factor 5.0 20.0 15.0 0.6021 0.4382 0.44563 #2–4 IB factor 5.0 15.0 20.0 0.8769 0.6585 0.37812 #2–5 IB factor 3.0 25.0 15.0 0.3936 0.4468 0.36887 #2–6 IB factor 1.0 20.0 15.0 0.1801 0.3688 0.24754 #2–7 Center 3.0 20.0 20.0 0.7743 0.6874 0.53816 #2–8 Center 3.0 20.0 20.0 0.3804 0.7676 0.54413 #2–9 IB factor 3.0 25.0 25.0 0.7060 0.7417 0.63741 #2–10 IB factor 1.0 25.0 25.0 0.6160 0.8087 0.50225 #2–11 IB factor 3.0 15.0 15.0 0.5406 0.3230 0.38335 #2–12 IB factor 3.0 25.0 25.0 0.5591 0.7662 0.47410 #2–13 IB factor 5.0 20.0 20.0 0.2696 0.3910 0.59556 #2–14 Center 3.0 20.0 20.0 0.4471 0.6925 0.55291 #2–15 IB factor 5.0 25.0 25.0 0.5036 0.4329 0.88435 #2–16 IB factor 1.0 20.0 20.0 0.6652 1.3879 0.55577 #2–17 Center 3.0 20.0 20.0 0.6547 0.7400 0.59108 JOURNAL OF COSMETIC SCIENCE 338
Purchased for the exclusive use of nofirst nolast (unknown)
From: SCC Media Library & Resource Center (library.scconline.org)