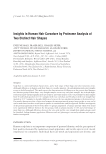
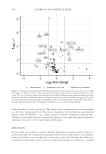
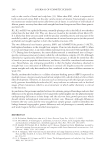
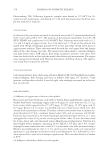
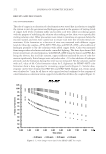
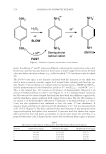
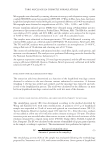
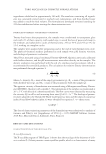
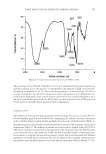
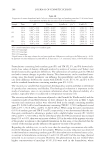
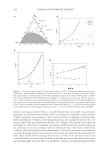
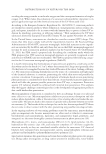
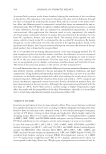
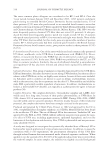
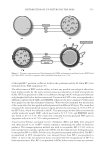
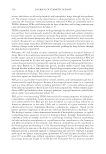
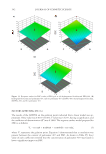
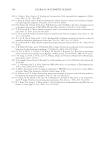
dynamic percolation model. That is, a micelle barrier layer or possible microemulsion aggregates are formed by short-chain alcohol as a surfactant, although a certain amount of water molecules may permeate it due to the interaction of hydrogen bonds between water and ethanol (3). Based on the experimental data, the calculated value for the coef- fi cient p above the percolation threshold is 0.32 (Figure 1D), and as such cannot be attributed to either static or dynamic percolation model because the obtained value for the coeffi cient p is not in accordance with the theoretical value. The main reason for this is that at values above the percolation threshold φwp, due to the intramolecular interaction caused by hydrogen bonds, more and more water molecules penetrate the barrier layer of short chain alcohol with increasing mass fraction of water (3,9). Similar to that in the citronellol system, the short-chain alcohols are not able to form an effective barrier layer of microemulsion-like structure. They can only form a solution containing hydrogen-bonded Figure 1. (A) Ternary phase diagram of citral–ethanol–water at 298.15 K, where the white area represents a single-phase, macroscopically homogeneous system, whereas the gray area represents a two-phase system. The squares refer to selected samples (A-E) of the single-phase ternary citral–ethanol–water system at 298.15 K for measuring DLS. (B) The conductometric mapping of a single-phase ternary citral–ethanol–water sys- tem at 298.15 K refers to the experimental paths shown by the dashed lines in (A). (C) The dependence of electrical conductivity on the mass fraction of added water in a single-phase ternary citral–ethanol–water system at 298.15 K at a constant ratio of the mass fraction of ethanol and citral, RE/C = 2.3. (D) The variation of log κ versus weight fraction of water along the dilution line RE/C = 2.3 above and below the percolation threshold. JOURNAL OF COSMETIC SCIENCE 294

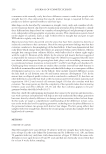
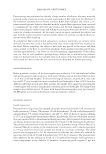
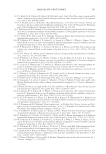
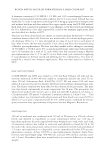
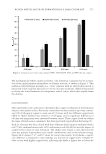
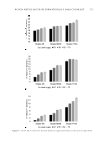
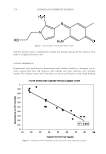
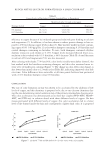
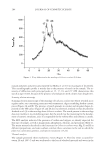
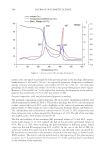
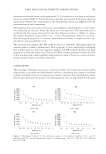
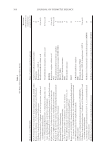
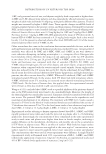
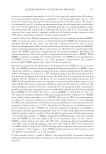
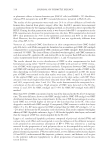
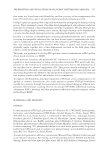
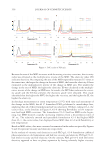
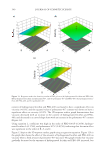
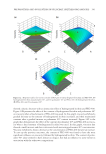
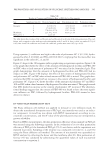
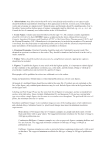
Figure 2. (A) Absorption of aqueous solutions of methyl orange in a ternary mixture of citral–ethanol–water at a constant ratio of mass fractions of ethanol and citral (RE/C = 2.3) and different proportions of added aque- ous solutions of methyl orange (φw), where the concentration of the methyl orange solution is c = 0.1 mmol L-1. (B) Time-dependent self-correlation functions as obtained by DLS for prepared samples (Figure 1A). The size of particles is calculated from well-defi ned correlation functions only. SURFACTANT-FREE MICROEMULSIONS 295
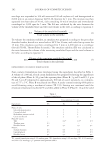
Purchased for the exclusive use of nofirst nolast (unknown)
From: SCC Media Library & Resource Center (library.scconline.org)