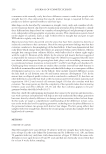
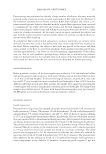
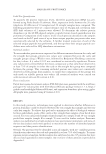
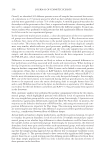
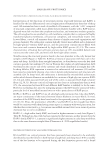
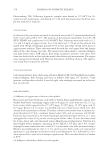
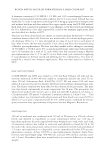
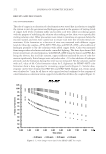
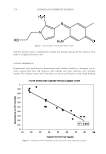
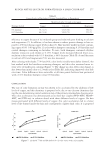
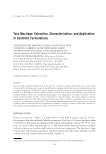
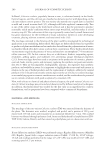
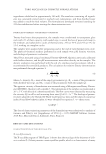
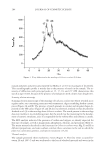
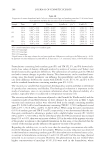
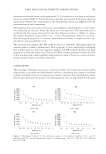
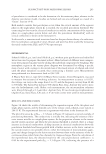
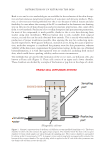
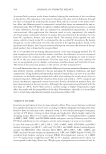
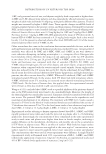
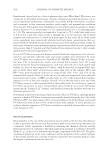
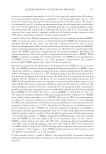
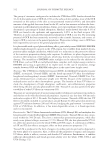
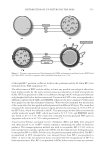
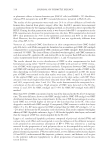
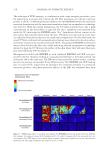
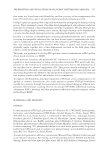
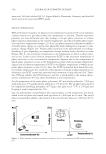
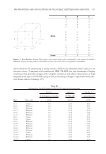
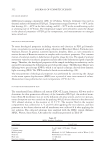
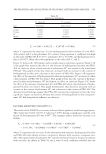
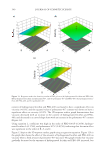
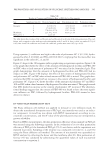
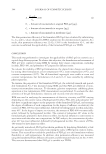
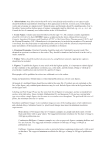
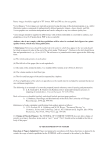
#2–3 resembled a microemulsion-based gel (10,30) and polymeric bicontinuous micro- emulsion structure (31) (Figure 6). A bicontinuous microemulsion structure is formed by mixing the appropriate amounts of oil, water, and amphipathic substances, and bicon- tinuous microemulsion is known to form an interesting structure consisting of undula- tion and boundary having a mean curvature (32). DS C MEASUREMENT Th e infl ection points of the DSC curves of the formulated PLO gel commonly lingered around –10°C, which corresponds to the temperature where property changes in PLO gel began to occur (Figure 7). Pha se separation or reduced viscosity (fl owability) occurred at low temperature (4°C) in the formulated PLO gel #2–5, #2–6, and #2–11, with DSC values of less than 0.4 around the peak of –10°C as shown in Figure 7, and this resulted in pre-marked marks on the surface disappear. On th e contrary, PLO gel formulations with DSC values of greater than 0.4 at –10°C were mostly stable. These results indicate that there is a correlation between formulation stability and DSC value. RHEOLO GY STUDY RESULT Rheolo gical characteristics were assessed using a rheometer. This instrument uses DWS, which is an optical technique derived from DLS. Because a rheometer determines rheo- logical properties based on the Brownian motion, this instrument has the advantage of accurately identifying formulation properties compared with physical appraisal methods. With rheology measurement, particle motion speed represents viscosity and particle dis- placement denotes elasticity. To pre sent them into numerical values, index values were obtained through data process- ing of the change in MSD with time. Macro viscosity index (MVI) indicates viscosity. Figure 6. Cryo FE-SEM result of PLO gel #2–3. PREPARATION AND EVALUATION OF PLURONIC LECITHIN ORGANOGELS 335

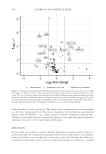
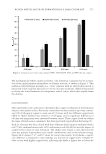
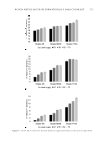
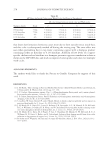
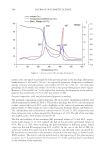
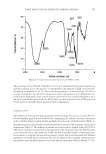
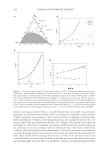
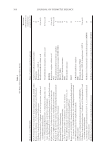
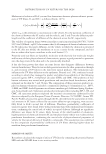
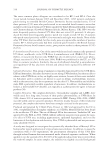
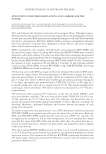
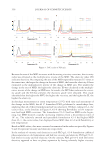
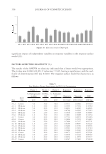
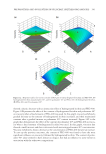
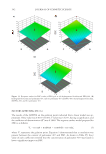
Because the area of the MSD increases with decreasing viscosity over time, the viscosity index was obtained as the multiplicative inverse of the MSD. The elasticity index (EI) indicates elasticity. By comparing the area of the MSD repeatedly measured 15 times at the same time, the larger the change in the area of MSD, the lower the elasticity. EI was estimated as the multiplicative inverse of the change in MSD area. The smaller the change in the area of MSD, the higher the elasticity EI was calculated as the multipli- cative inverse of the change in MSD area. As results, the MVI that indicates the viscos- ity grade and the EI that presents the elasticity grade were obtained. This study identifi ed that the higher the MVI, the higher the viscosity, and the higher the EI, the higher the elasticity. In rhe ology measurement at room temperature (25°C) with time and assessment of the change in the MSD, the all 17 formulated PLO gel showed a curved-shape line, implying that all of these formulations had viscoelasticity. Of these, taking #2–1, the center value, as the baseline in Figure 8, #2–6 showing fl owability at low tempera- ture had high MSD over time. The formulation #2–12 had low MSD in the begin- ning, but MSD showed a rapidly increasing tendency from a decorrelation time of 102 sec. The relatively smooth and spreadable formulation #2–3 had higher MSD than #2–1, the center value, but displayed lower MSD than #2–6 with fl owability at low temperature. Based o n MSD values, data were converted to numerical index values reciprocally. Figures 9 and 10 represent viscosity and elasticity, respectively. In the analysis of viscosity and elasticity in each PLO gel, #2–6 formulation exhibited phase separation at cold temperature and had low viscosity and elasticity. PLO gel #2–11 had lowest viscosity and low elasticity. On the contrary, PLO gel #2–2 with the lowest elasticity appeared to have no phase separation by having relatively higher viscosity. Figure 7. DSC results of PLO gels. JOURNAL OF COSMETIC SCIENCE 336
Purchased for the exclusive use of nofirst nolast (unknown)
From: SCC Media Library & Resource Center (library.scconline.org)