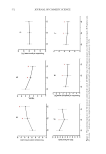
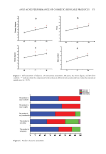
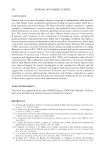
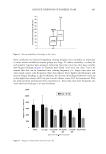
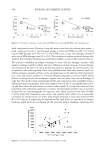
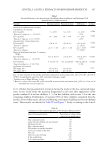
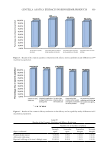
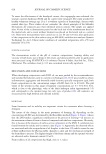
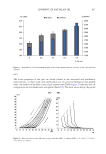
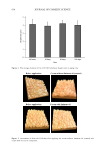
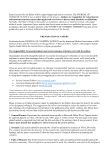
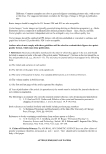
605 FATIGUE STRENGTH OF PANELIST HAIR Some correlation was observed regarding coloring frequency but variability in individual α-values meant variability between groups was large. To reduce variability, α-values for each panelist response were averaged, indicating that time since last color does correlate with fatigue breakage (Figure 4). Panelists were asked “time since last color,” but if we assume that this can be translated into coloring frequency (i.e., longer time since last color equals a lower color frequency), these data indicate that a higher color frequency will increase fatigue breakage at tips. In addition, the decrease in breakage from root versus tip is also higher for colorers (40% for past 4-week colorers versus 10% for noncolorers). This fits with anecdotal information from consumers (i.e., those who color more frequently also claim that hair breakage is an issue for them). Figure 3. Percent probability of breakage at 500 cycles. Figure 4. Fatigue α-value versus time since last color.

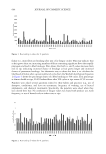
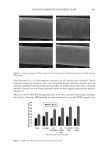
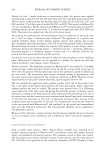
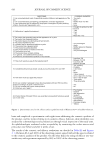
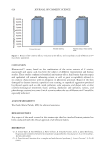
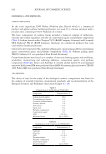
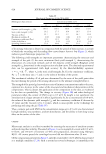
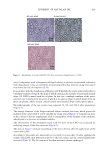
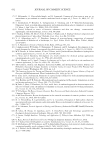
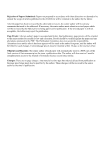
606 JOURNAL OF COSMETIC SCIENCE Two other measures of damage were performed on the same 41 panelists: cysteic acid measurement using FTIR and cuticle integrity using a SEM damage scale. Cysteic acid is an industry method that has been shown to correlate with oxidation from colorants and bleaches (8). It is a nondestructive method that quantifies formation of cysteic acid via the S–O stretch at 1,040 cm-1. This study measured every 5 cm down the hair from root to tip. As expected, panelists who claimed to have never used hair color showed only a slight increase in cysteic acid (∼10%, likely due to UV oxidation). Panelists who had colored in the last year or more frequently showed a much higher level of increase. Average cysteic acid values increase for mid and tip hair as time since last color decreases (Figure 5). This supports for our assumption that time since last color can be corelated with frequency of coloring. No difference is seen for root hair other than an increase for the group who colored in the last 3 mo. All other groups had noncolored regrowth at their roots and showed a low FTIR score. We did not see a linear increase in FTIR score from root to tip and the mid value was consistently only about 10–20% lower than the tip value. This may be due to not all-over coloring habits or, more likely, due to cuticle removal via brushing/combing. The FTIR method only measures surface cysteic acid (penetration depth 2–5 µm) and overall cysteic acid decreases or flattens as cuticle with high-cysteic acid is physically removed. Cuticle damage was assessed via SEM grading where 25 fibers at mids and tips were graded on a four-point scale. Low damage: cuticle aligned and spaced regularly but some irregularity or slight lifting of the cuticle is observed (up to ∼15% lifting). Mid damage: cuticle is irregularly spaced due to missing cuticle edges, but all cuticle is present is tightly packed with lifted cuticle edges. High damage: any cuticle missing up to 50% of fiber significant cuticle chipping and partial removal of cuticles. Stripped: majority of fiber stripped (must be 50%). HDSS was calculated from this grading to calculate a single number: HDSS = (1× low) + (3× medium) + (5× high) + (7× stripped)*(100/175). Figure 6 shows example images of each grade. Cuticle damage was minimal at mids but increased significantly at tip (Figure 7). The increase was notably higher as time between Figure 5. Cysteic acid FTIR value versus time since last color.
Purchased for the exclusive use of nofirst nolast (unknown)
From: SCC Media Library & Resource Center (library.scconline.org)