INFRARED SPECTROSCOPY OF ESSENTIAL OILS* By A. K. PRESNE,,, P.D. /lndrew •ergens Company, Cincinnati, Ohio THE EXAMINATION OF essential oils by infrared spectrophotometry is by no means new, but the application of the method to these materials has been the exception rather than the rule. In several respects the method is exceptionally well suited to essential oil analysis. It is one of the very few methods which can be applied to a mixture which will give information on each of the components of the mixture. It may be applied to very small amounts of material, such as the traces of materials sometimes separated from essential oils. It gives a great deal of evidence of the chemical struc- ture of a compound. When performed with a double-beam instrument it is quite rapid. It is applicable to all essential oils. Finally, essential oils are practically all soluble in one or both of the solvents of choice, carbon tetrachloride and carbon disulfide. Inasmuch as many of those who are interested in essential oils have not had occasion to become well acquainted with infrared spectrophotometry, a brief discussion of the theory and method involved may not be amiss. .lust as visible light is radiant energy covering a range of wave lengths from about 0.4 to 0.7 of a micron, infrared is radiant energy, but of a wider range and of longer wave lengths. The portion of this range of immediate interest to us is 2 to 16 microns, although the infrared region extends much farther. Just as some substances absorb certain wave lengths of visible light and therefore have characteristic colors, so different substances absorb various wave lengths in the infrared. All organic compounds and prac- tically all inorganic ones absorb in the 2.0 to 16.0 micron region. A spectrophotometer is an instrument capable of measuring the intensity of the energy at each increment of wave length throughout the region under consideration. By comparison of the amount of energy transmitted through a sample with the amount falling upon it, the per cent of transmit- tance or some derived function is obtained. The spectra given here were drawn by a Baird Associates double-beam infrared spectrophotometer, which makes the necessary comparative measurements and records the results automatically as a curve of per cent transmittance plotted against wave length. * Presented at the December 11, 1952, Meeting, New York City. 101

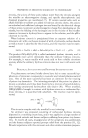
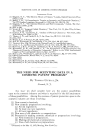
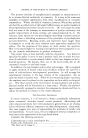
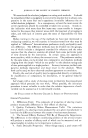
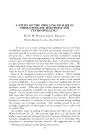
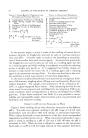
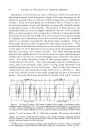
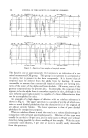
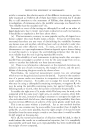
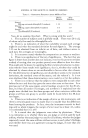
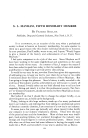
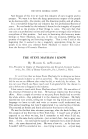
102 JOURNAL OF THE SOCIETY OF COSMETIC CHEMISTS Absorptions in the infrared are due to vibrations within the molecule of absorbing material, these absorptions being of the same frequency as the vibrations causing them, or overtones of these frequencies, or combinations of them. Each structural group of a molecule is free to vibrate in only a very limited number of ways and therefore can cause only a limited number of absorption bands in the infrared. The position of these bands is not absolutely fixed, but may be slightly altered by the rest of the molecule. This is a disadvantage in that it makes the correlation of absorption bands with chemical structuremore di•cult in some cases, but it has the advantage of yielding some information about the structural portion of a molecule which is not directly responsible for the band being considered. Some of the stronger bands are easily recognized by their shape and position. Thus we find that all alcohols show absorption in the vicinity of 3.0 microns, and in the region of 7.0 to 10.0 microns have bands which distinguish between primary, secondary, and tertiary alcohols. All carbon-hydrogen groups absorb in the neighborhood of 3.4 microns, the exact region depending upon whether there are one, two, or three hydrogen atoms attached to the carbon atom. Two other absorption bands of these groups appear at approxi- mately 6.8 and 7.2 microns. The carbonyl group, common to a]dehydes, ke- tones, esters, and carboxylic acids, causes a strong, sharp absorption band usually lying between 5.8 and 6.0 microns. Each of these four classes of compounds has other distinctive bands which serve to identify it. Also, many acid radicals of esters have easily recognized patterns of absorption bands. Aromatic ethers may be detected by bands at 8.0 and 9.7 microns, WAVE NUMBERS IN CM4 WAVE NUMBERS IN Ck, fl S000 4OO0 *•000 2•O0 500 400 100 200 O0 0O0 BOO IO0 7OO 2 MICRONS 0 II WAVEI2LENGTH IN I•ICRON$ 14 I$ Figure 1.--3.0 and 9.5 microns, OH bands of phenyl ethyl alcohol 3.4 microns, carbon- hydrogen bands of aldehyde C-11 3.7 microns, aldehyde band of aldehyde C-11 4.5 microns, --C•C-- band of methyl heptine carbonate * 5.8 microns, carbonyl band of aldehyde C-11 6.1 microns, C=C band of aldehyde •-11 6.7 and 6.9 microns, benzyl group ofphenyl ethyl alcohol 7.2 and 7.4 microns, CHa--C--CHa band of menthol 8.05 microns, ether band of anisole 11.3 microns, •CH2 band oflimonene 14.1 and 14.7 microns, cinnamate bands of methyl cinnamate 14.4 microns, phenyl band of phenyl ethyl alcohol and 14.4 and 14.7 microns, salicylate bands of methyl salicylate. * Author's note: The absorption band at approximately 4.5 microns in Fig. 1 attributed to the triple bond of methyl heptine carbonate is really due to the group --C•C--C•-----O.
Purchased for the exclusive use of nofirst nolast (unknown)
From: SCC Media Library & Resource Center (library.scconline.org)