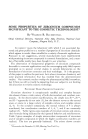
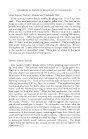
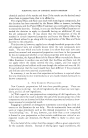
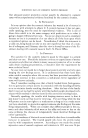
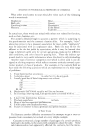
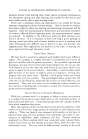
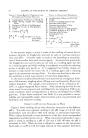
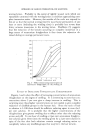
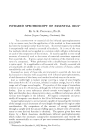
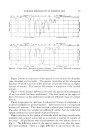
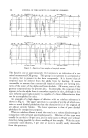
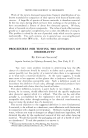
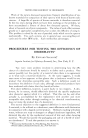
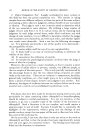
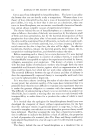
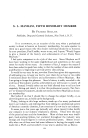
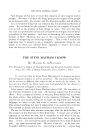
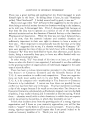
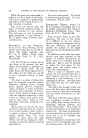
INFRARED SPECTROSCOPY OF ESSENTIAL OILS 103 and aliphatic ethers show absorption at approximately 9.0 microns. Double bonds between carbon atoms cause a band at 6.1 microns, but if these are conjugated double bonds, the band is shifted to a slightly longer wave- length. The unsaturated terminal =CH2 group is responsible for an addi- tional band at about 11.3 microns which is frequently useful. The presence or absence of this band may be decisive in determining which of two possible structures of a terpene is the correct one. Triple bonds cause a sharp, strong band at about 4.5 microns. Figure 1 is a composite curve designed to show what some of the prominent, easily interpretable bands look like. All curves show absorption of 0.1-min. layers of 10% solutions in carbon tetrachloride. Other bands show the number and position of substituents on the ben- zene ring. Cis-trans isomers and even stereoisomers may be distinguished by means of infrared absorption spectra. A few simple aliphatic groups such as the isopropyl and the tertiary butyl group are readily detected. A great many other correlations have been worked out, but they are pri- marily of interest in fields other than essential oils. Since the correlation between chemical structure and infrared absorp- tion exists, it follows that each chemical compound will have its own unique spectrum by which it may be identified as certainly as a man may be identi- •VA','E NUMEERS lU CM' WAVE NUMBERS I• •o• 40 - 0 WAVE LENGTH IN MICRONS WAVE LENGTH IN MICRONS WAVE NOMEERS IN CM-I WAVE NUMBERS IN CM I [ io i $m iN i icloNs i i i WAY

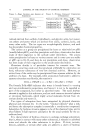
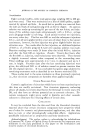
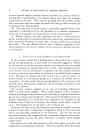
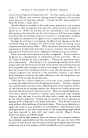
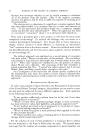
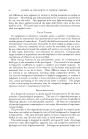
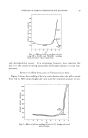
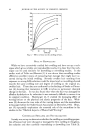
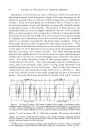
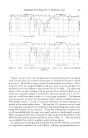
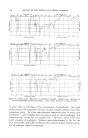
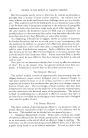
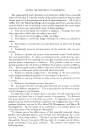
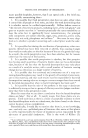
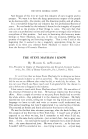
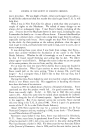
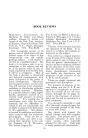
104 JOURNAL OF THE SOCIETY OF COSMETIC CHEMISTS fled by his fingerprints. It should be noted that in some cases higher homo- logues of a series may have spectra so similar to each other as not to be dis- tinguishable in the 2.0 to 16.0 micron region. For example, the spectra of palmitic and stearic acids appear identical. At longer wave lengths, where absorption is determined by molecular rotation, it should be possible to distinguish them. The ability of infrared spectrophotometry to show the identity of sub- stances constitutes one of its most useful applications to essential oils. In the case of pure chemicals it readily establishes identity. However, the odor value of such a material may depend upon the absence of relatively minute amounts of impurities. These are usually overlooked by this method, and therefore the nose is a better judge of quality of a chemical which is known to be essentially pure. When the spectrum of a mixture of materials is derived, all of the absorp- tion bands of all of the constituents appear. Of course, the intensity of the individual bands is dependent upon the relative concentration of the ma- terial responsible for them. Thus it is possible to identify mixtures, such as naturally occurring oils, and to check their constancy of composition from sample to sample. In a similar manner it is usually very easy to detect adulteration or dilution of an oil. WAVE NUI,•BEI•S IN CM' WAVE NUMBERS IN CM• 50OO 4000 3000 2S0O 2000 IS00 1400 1300 1200 II00 1000 900 •n• i0o •-. TM 625 0 WAV LENGTH IN MICRONS WAVE LENGTH iN MICRONS WAVE NUMBERS iN CM, WAVE NUMBERS iN C:M I $o0o 4o0o 3000 •s• zoee isoo 14oo 130o iz0o Hoo iooo 90o 700 poo I , a, J i II'l II1[1111 ' ] i,• , r ...... i, i illill I , 6ZS •0 ] Io 4 S 6 7 8 e •0 •1 12 I• 14 IS WAVE LEN•aTH JN MICRONS WAVE LEN•aTH IN MICRONS Figure &--Upper curve: Spectrum of pure bergamot oil. Lower curve: Spectrum of adulter- ated bergamot oil.
Purchased for the exclusive use of nofirst nolast (unknown)
From: SCC Media Library & Resource Center (library.scconline.org)