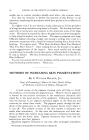
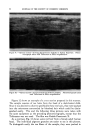
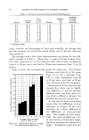
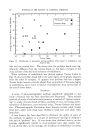
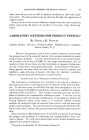
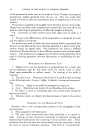
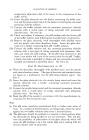
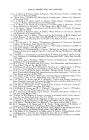
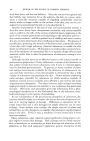
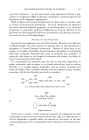
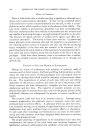
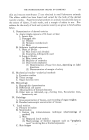
98 JOURNAL OF THE SOCIETY OF COSMETIC CHEMISTS TABLE 2--AVERAGE CHARACTERISTICS Or ADULT HAIR SAMPLES Sample Load, gm., Area Medulla- per Hair Trotter X 1.06, tion, at 20% Index sq. In. Density % Extension A-1 72.0 9.51 1.13 85 31.4 A-2 70.9 6.63 1.18 40 23.1 A-3 67.4 6.78 1.22 45 24.2 A-4 72.2 5.56 1.26 45 21.2 A-5 64.7 9.52 1.14 65 23.9 A-6* 70.0 5.73 1.07 10 14.3 A-7 76.3 8.22 1.19 70 26.1 A-8 68.5 6.55 1.18 30 21.3 A-9 66.4 5.99 1.10 45 17.9 A-10 62.4 12.72 1.10 95 35.8 * "Problem" Hair. areas, densities and percentages of hairs with medullas, the average load per hair necessary to stretch the sample 20 per cent in the wet state was also measured. The average results from these determinations are shown for the chil- dren's samples in Table 1. These show a range of Trotter Indexes from 63 to 90 areas from 4.7 to 6.6 densities from 1.09 to 1.23 medullation from 0 to 50 per cent and load at 20 per cent extension from 15 to 18 grams. Table 2 shows the corresponding results for adult hair. The Trotter Indexes vary from 62 to 76 areas 100 =• 90 • 80 5 70 •. 60 • 50 • 40 • 30 •0 20 4 •0 0 3 4 5 6 7 8 9 1011 12 13 Average Cross-Sectional Area X 10 6 (sq. in.) Figure 18. Relationship between medulla- tion and cross-sectional area. from 5.5 to 12.7 densities from 1.07 to 1.26 medullation from 10 to 95 per cent and load at 20 per cent extension from 14 to 36 grams. Examination of the data quickly showed that there was no signifi- cant difference in density between children's hair and adult hair, nor was there a difference between the problem hair and the normal hair. It can also be shown from these results that the differences in load necessary to achieve 20 per cent extension are a direct reflection of the differences in cross-sectional area. The samples all have essen- tially the same strength per unit of cross section if the area is larger, the force necessary for extension is larger. It might be noted that the

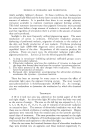
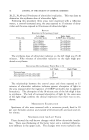
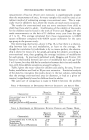
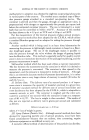
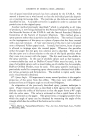
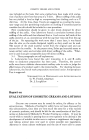
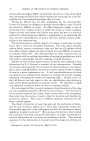
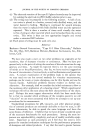
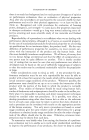
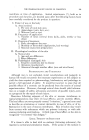
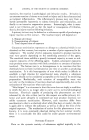
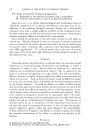
PHOTOMICROGRAPHIC TECHNIQUES FOR HAIR 99 measurement of load at 20 per cent extension is experimentally simpler than the measurement of area for many samples this could be used as an indirect method of estimating average cross-sectional area. This is espe- cially true for children's hair, where the results are much more consistent. The results for cross-sectional area are more consistent from child to child than from adult to adult. Confirmation of the validity of the results for the children may be found in the work of Trotter and Duggins (9) who made measurements on the hair of 11 children every year from the ages of 5 to 12. The average calculated from those measurements is 0.0032 square millimeter compared with 0.0034 square millimeter for the same age group in the present study. One interesting observation, shown in Fig. 18, is that there is a relation- ship between hair size and medulladon, at least on the average. Al- though the correlation by individuals is by no means perfect, the relation- ship is shown by means of a bar graph, grouping the subjects according to cross-sectional area, then graphing the average incidence of medullation for each group. In previously published work, Duggins and Trotter (13) found no relationship between per cent of medullated hair and age from 5 to 14 years, but they did find a correlation between hair size and medulla- tion, with three definite exceptions among 16 subjects. Table 3 gives the mean values for children and adults, for area, Trotter Index, medulladon and load at 20 per cent extension. Statistical analysis of the data by t-test gives the results shown in the last column, indicating that the average cross-sectional area (or diameter, or load at a given ex- tension) is significantly lower for children than for adults. The same sort of comparison is made in Table 4 between the problem TABLE 3--SIGNIFICANCE OF DIFFERENCES BETWEEN CHILDREN'S AND ADULTS' HAIR Level of Signifi- Mean for Mean for cance of Characteristic 10 Children 10 Adults Difference, % Cross-sectional area X l0 s, sq. in. 5.37 7.72 Trotter index 75.0 69.1 Medullation, % 29 53 Load, gm., per hair at 20% extension 16.9 23.9 99 9O 95 99 TABLE 4--SIGNIFICANCE OF DIFFERENCES BETWEEN PROBLEM AND NORMAL HEADS Characteristic Level of Mean for Mean for Signifi- 6 Problem !4 Normal cance of Heads Heads Difference, Cross-sectional area X 106, sq. in. 5.43 7.03 Trotter index 77.4 69.7 Medulladon, % 19 50 Load, gm., per hair at 20% extension 16.8 22.4 90 98 99 85
Purchased for the exclusive use of nofirst nolast (unknown)
From: SCC Media Library & Resource Center (library.scconline.org)