GAS-LIQUID CHROMATOGRAPHY IN THE ANALYSIS OF PERFUMES 181

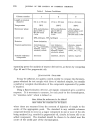
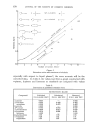
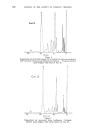
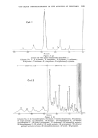
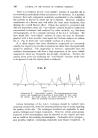
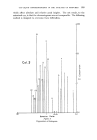
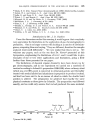
182 JOURNAL OF THE SOCIETY OF COSMETIC CHEMISTS its retention ratio relative to a standard on a non-polar (A) and on a polar (B) stationary phase •4. It is necessary first to calibrate for homologous series of various types of compound and plot the log (retention ratio) on column A against the log (retention ratio) on column B, when each series will produce a different straight line. The appropriate values for the unknown compound will then fall on one of the lines, thus classifying it. This method is applic- able only to compounds containing one functional group in the molecule and is therefore more likely to be of value for synthetic flavour components than for essential oils. QUANTITATIVE ANALYSIS The usual methods of determining concentrations of components from the areas of peaks on the chromatogram have been described previously TM. However, the need for careful calibration of the vapour detector and checking its linearity of response to increasing concentrations of vapour should be emphasised. The sensitivity of a flame-ionisation detector is a function of its geometry •5 and also varies according to the chemical type of compound being detected. In general, hydrocarbons give a larger response than oxy-compounds, but the differences become less marked as molecular weight increases. For compounds containing ten or more carbon atoms the sensitivity is nearly constant and equal for all types. Hence an approximate analysis of essential oils can be made by simply relating peak areas to concentrations. However, if the sample for analysis is known to contain low molecular-weight com- pounds, quantitative calibration of peak areas against concentration must be made with standard compounds or obtained from published data •6. Superimposed upon the variation of sensitivity with compound type is the variation with concentration, i.e. "non-linear response". The effect can be easily recognised by determining calibration factors for standard materials injected at various concentration levels. Non-linearity can usually be avoided by minimising the size of sample injected onto the column and operating the amplifier at high sensitivity. Large samples analysed at low sensitivity emphasise the effect and give misleading chromatograms as shown in Fig. 6 compared with Fig. 4b. QUALITY CONTROL Individual essential oils Chromatograms of essential oils can usually be satisfactorily made on one or more of the columns detailed in Table I. Identification of peaks follows the methods described under qualitative analysis. There are, however, certain limitations which are frequently overlooked.
Purchased for the exclusive use of nofirst nolast (unknown)
From: SCC Media Library & Resource Center (library.scconline.org)