RHEOLOGICAL CHANGES IN EMULSION PRODUCTS WHEN AGED 599 • O/ I

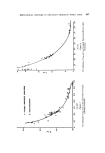
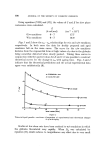
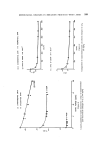
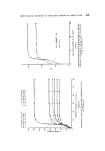
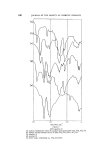
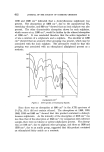
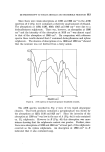
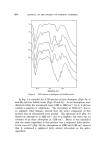
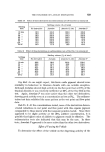
•600 JOURNAL OF THE SOCIETY OF COSMETIC CHEMISTS globules, it was found that n- D•, plots for fresh and aged emulsions did not coincide. For any D•, selected, the fresh emulsion always had a higher 7 than the emulsion which reached this same D• after a period •)f ageing. Similarly, when emulsions reached a selected D•, after different short ageing times the shorter time the emulsion had aged the higher its value of 7. These divergencies disappeared after longer ageing periods. Using the modified procedure for calculating D• good correlation was achieved at two different low rates of shear- 1.20 sec% and 10.77 sec -• between theoretical predictions and experimental data (Fig. 5). The influence of fiocculation on the rheological properties of an aged concentrated w / o emulsion A w/o emulsion (• = 47%) was aged for several days. Each day a sample was withdrawn, stirred for five min at 215.5 sec -• at 21øC, and the rate of viscosity recovery at 1.33 sec -• was then studied. An appreciable breakdown of structure occurred at the higher shear rate. The freshly prepared emulsion gave a viscosity of 10.5 poise after shearing for 5 min at 215.5 sec -•. Subsequently the viscosity rose to 139 poise at 1.33 sec -• (Fig. 6). The latter value was reached in about 30 sec with most of the recovery occurring with 10 sec of switching over to the low shear rate. Emulsions aged for 24-189 hr gave viscosities similar to that of the fresh emulsion after shearing for 5 min at 215.5 sec -•. Following structural recovery at 1.33 sec -• large differences were apparent between fresh and aged emulsions. The longer the emulsion had been .aged, the lower the final steady-state viscosity. The major drop in steady- state viscosity took place during the first 24-44 hr of ageing. This corre- sponds to the time taken by globules less than 0.St, diameter to disappear by coalescing with larger globules or between themselves. From fhe data given in Fig. 6 one can calculate the apparent increase in • due to flocculation. Mooney (14) interpreted thixotropic recovery 'from similar data using an empirical 7•o-• equation 7•o %/1 + 0.5 • ex p (1.25 •0• = 1 - \ 1----7/ (x) It will be noted that equation 10 does not •allow for the influence of globule size on 7oo. A more representative curve relating 7øo to • can be derived by equation V. The apparent • for any sample is obtained by referring the measured 7 at 1.33 sec -• to this curve and determining the
Purchased for the exclusive use of nofirst nolast (unknown)
From: SCC Media Library & Resource Center (library.scconline.org)