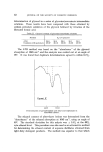
J. Soc. Cosmetic Chemists 17 9-16 (1966) ¸ 1966 Soc,ety of Cosmetic Chemists of Great Britain Application of Attenuated Total Reflectance IR spectroscopy to toilet articles and household products, 2.-Ouantitative analysis N. A. PUTTNAM, B. H. BAXTER, S. LEE and P. L. STOTT* Presented in part at the Xlth Colloquium Spectroscopicum Internationale, Belgrade 1963. Synopsis•The application of Attenuated Total Reflectance IR spectroscopy to the quantita- tive analysis of toilet articles and household products is described. The analyses were carried out by comparison with calibration curves prepared from standard samples. Examples are quoted of the determination of lauryl ether sulphate and salts of sulphated fatty alcohols in shampoos, the determination of glycerol in glycerine/sarcosinate solutions, the determina- tion of ethanol in aqueous ethanol systems, the simultaneous determination of pyrophosphate and alkyl aryl sulphonate in a household cleaner, and moisture in soap. The relative accuracy of these analyses was 4- 1.5 to -I- 3.0% and as each determination required less than 8 min they could be used for the routine control of such products. INTRODUCTION The application of Attenuated Total Reflectance IR spectroscopy to the qualitative identification of components in toilet articles and house- hold products has been described previously (1), together with the principle of the technique. From the quantitative aspect, although Beer's law is not valid for reflection spectra, it is still a fair approximation (2) and several reports have appeared of relationships having been established between formal "absorbance" and concentration. Fahrenfort (3) showed that such a relationship existed for the 907 and 992 cm -x absorptions of decene-1 in Nujol, while Wilhite and Ellis (4) described the determination of the *Research and Development Dept., Colgate-Palmolive Ltd., Manchester 5.

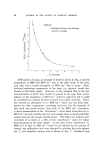
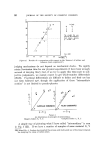
10 JOURNAL OF THE SOCIETY OF COSMETIC CHEMISTS nitrate ion in aqueous solutions. Such a determination was also reported by Katlafsky and Keller (5), who extended the technique to the deter- mination of the sulphate ion and 2-methyl-2-nitro-l-propanol in aqueous solutions. In this communication we wish to describe the application of ATR to the quantitative determination of relatively major components in various types of toilet articles and household products. EXPERIMENTAL The ATR spectra were recorded on a Unicam SP 200 IR spectrometer using a TR-3 ATR attachment, manufactured by Research and Industrial Instruments Co. An Irtran II prism was employed as the analysing crystal and the reference beam was attenuated to give an absorbance value of approximately 0.1 at a wavelength where the sample showed no absorption. Liquid samples were introduced with a syringe through the filler-ports into the cell formed by fitting the backing plate, with a Teflon seal, to the prism mount, care being taken to ensure that there were no air bubbles in the cell. Viscous liquids were poured on to the back face of the prism, held in a horizontal position, and the backing plate then clamped in position. In the case of soap samples, these were shredded on a cheese grater and a portion of ,the shredded samples pressed against the back face of the prism. For the preparation of calibration curves the ATR spectra of a series of standard samples (in most cases these were prepared by dilution of a reference concentrated sample) were recorded. The "absorbance" of the characteristic peak was measured, using a tangent base-line, for each standard and plotted against the % w/w concentration of the component. For the analysis of a sample, the ATR spectrum was recorded on the sample "as is" by a similar procedure to that used to prepare the appro- priate calibration curve. RESULTS AND DISCUSSION The angle selected for each analysis was that which gave the greatest absorbance value but still produced absorption peaks which did not appear distorted. It varied for each type of sample but was within the range 33 to 40 ø. To eliminate any possible backlash in the ATR attachment the angle setting was always made by approaching from low angle side. For most liquid samples a linear calibration curve of "absorbance"
Purchased for the exclusive use of nofirst nolast (unknown)
From: SCC Media Library & Resource Center (library.scconline.org)