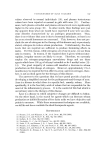
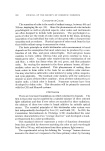
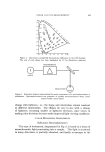
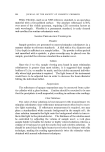
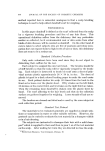
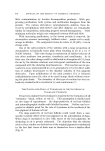
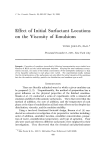
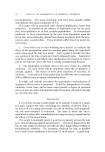
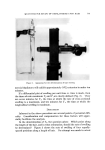
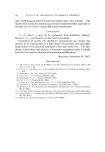
656 JOURNAL OF THE SOCIETY OF COSMETIC CHEMISTS 400 700 400 700 SAMPLE REFLECTANCE (R) SOURCE EMISSION (E) RxE SPECIFYING THE COLOR OF A SAMPLE Figure 7. Schematic diagram for interaction factors to produce color vision surface. Measurements may be plotted as reflectance rs. wavelength using a relatively nonabsorbing white reference standard. This infor- mation is then used for quantitative Kubelka-Munk equations or it may be converted to tristimulus values which will be discussed. Commercial instruments include the Hardy General Electric Spec- trophotometer, Bausch & Lomb Spectronic 505 with reflectance attach- ment, as well as the Beckman DU Spectrophotometer with the reflect- ance accessory. The G. E. instrument has a recorder and automatically converts reflectance data to tristimulus values. The Bausch & Lomb instrument has a recorder whereas the Beckman DU is a manual spec- trophotometer. Tristimulus Instruments It should be pointed out that the CIE system was developed to eliminate eye variations by using the "standard observer." The princi- ple behind tristimulus colorimeters, illustrated in Fig. 7, is as follows: A light source, E, strikes a sample having a reflectance curve, R. This interaction results in a reflectance energy, RE, which is specific for each wavelength this is also the energy striking the eye. This resulting RE passes the filters and is multiplied by each of the hypothetical color mix- ture curves oe, 9, and •, representing color vision of the standard observer in the CIE system. This produces three new curves, each having an area represented by the tristimulus values X, Y, and Z. The above manipulations again indicate that the CIE system specifies a color by three quantities, X, Y, and Z, called tristimulus values. These values

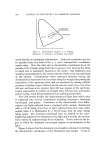
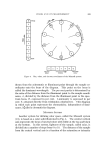
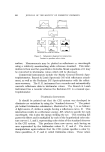
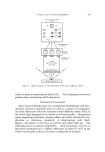
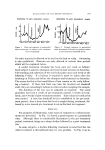
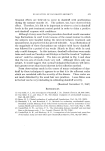
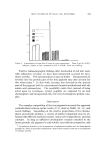
COLOR AND ITS MEASUREMENT 657 represent the amounts of primary red, green, and blue color that the standard observer would need to get a match. Ii each of these tri- stimulus values is divided by the sum of three, the resulting values x, y, and z, called chromaticity coordinates, give the proportion of the total stimulus attributed to each primary color. Furthermore, since the sum of the three chromaticity coordinates is unity, the values of x and 3' plotted on the chromaticity diagram may be used alone to specify the color. The third achromatic dimension of lightness or darkness is specified by the ¾ tristimulus value. The manipulations included in tristimulus colorimetry are mathematically presented below: Weighted Ordinate Calculation of Method Chromaticity Coordinates 700 X X = • ExC'Rx .•X x = •oo X + Y + Z 700 y Y = • 'Ex c'RX':?x y = •oo X + Y + Z 700 a Z = • Ex c'RX.zX z = •oo X + Y + Z z = I-- (x-t-y) The Hardy General Electric Spectrophotometer, previously dis- cussed, provides spectral reflectance curves in addition to tristimulus values. This combination results in nonmetameric matches in color formulations which are colors similar in appearance under all light sources. Tristimulus instruments alone often produce metameric matches which look the same only if similar viewing conditions are used. Instrument Development Laboratories (IDL) market the Color-Eye which is an abridged spectrophotometer giving 10 or 16 visible wave- length points as well as tristimulus values. The instrument is also de- signed to measure fluorescence of a sample since the tristimulus filters are placed between the sample and detector as illustrated in Fig. 8. A com- puter may also be purchased with the instrument to directly measure color difference in MacAdam units. A competitive tristimulus colorimeter called the Hunterlab D-25 Color Difference Meter (19),* schematically presented in Fig. 9, in- cludes vacuum phototubes, calibrated tristimulus filters, and a transis- * Hunter Associates Laboratory, Inc., 9529 Lee Highway, Fairfax, Va. 22080.
Purchased for the exclusive use of nofirst nolast (unknown)
From: SCC Media Library & Resource Center (library.scconline.org)