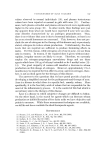
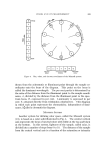
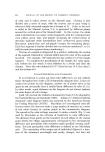
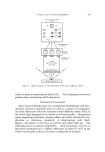
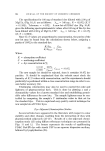
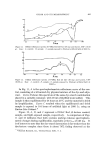
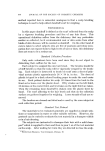
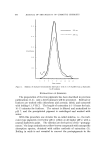
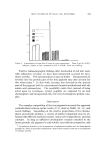
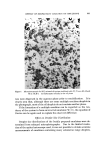
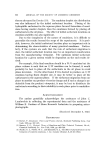
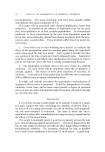
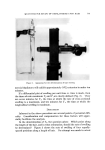
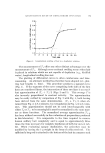
664 JOURNAL OF THE SOCIETY OF COSMETIC CHEMISTS The specifications for 100 mg of standard dye diluted with 2.00 g of MgCO3, (Fig. 10,A) are as follows' Xm•x = 540 mu R = 62.8% (K/S = 0.1102) Tolerance = •- 10%. A new lot of FD&C dye (Fig. 10,B) gives the following spectrophotometric values after 100 mg of the dye has been diluted with 2.00 g of MgCO3 USP' X ..... = 540 m• R = 65.5% (K/S = 0.0909). Since K/S values are proportional to concentration, the purity of the new lot may be found from the calculations shown below, assigning a purity of 100% to the standard dye. K/Ssta. Csta. _ (4) K/Xsamrle Csample Where K = absorption coefficient S = scattering coefficient C = dye concentration in % 0.02 oo% = -- Csamp•e = 81.6% 0.0909 Csample The new sample lot should be rejected, since it contains 18.4•c im- purities. It should be emphasized that the colorist must check the linearity of K/S values with concentration, and the experiments should preferably be performed within a close concentration range in order to en- sure better accuracy (24). Tristimulus colorimeters may also be used to control the color and lightness of pharmaceutical dyes. This is done by plotting x and y chromaticity values for a known standard dye and establishing permis- sible color differences for new lots. The sample lightness may be con- trolled by comparing the sample's Y tristimulus value to that set for the standard dye. This is a rapid and easy quality control technique for new sample lots of FD&C dyes. Dye-A djuvant Chemisorption Studies Several articles have appeared in the literature with respect to color stability and other changes resulting from the interaction of dyes with pharmaceutical adjuvants (25-27). Results of a dye-adjuvant chemi- sorption study (25) using diffuse reflectance techniques are presented in Figs. 11 and 12. The former represents the results of equilibrating FD&C Red #3 dye with starch USP in an aqueous dispersion medium, followed by lyophylization (25).

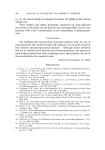
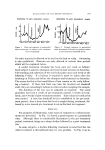
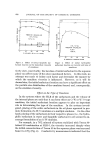
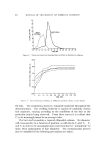
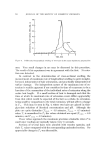
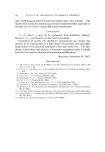
COLOR AND ITS MEASUREMENT 005 lOO A A 2•50 • I • 300 350 4.00 5JO 600 Figure 11. Diffuse reflectance spectra of FD&C Red •3 Dye (30 mg) and starch, USP (10.00 g). Key: A, control B, sample C, sample exposed to 184-hour artificiallight at 2000 f.c. lOO 2hO 2[0 300 3150 4•)0 5•0 6•0 9Jo Figure 12. Diffuse reflectance spectra of FD&C Red #3 Dye (30 mg) and lactose, USP (10.00 g). Key: A, control B, sample C, sample exposed to 184-hour artificial light at 2000 f.c. In Fig. 11, ,4 is the spectrophotometric reflectance curve of the con- trol, consisting of a triturated dry physical mixture of the dye and adju- rant. Curve B shows this spectrum of the same dye-starch combination placed in a suitable container, with 20 ml of distilled water added. This sample is then equilibrated for 24 hours at 30 øC and the material is dried by lyophilization. Curve C resulted when the equilibrated and dried sample is exposed to 184 hours of artificial light at 2000 f.c. using an Envira-Lite Cabinet.* Figure 12, ,4, B, and C represent a FD&C Red #3-lactose control, sample, and light-exposed sample, respectively. A comparison of Figs. 11 and 12 indicates that both systems undergo intense spectrophoto- metric changes during equilibration, especially at the Xm•x of 540 m•. It is of interest to note that the dye-starch interaction is far weaker than the dye-lactose complex since there is about 78% fading observed at the * Thermal Research, Inc., Thermal Road, Iselin, N.J.
Purchased for the exclusive use of nofirst nolast (unknown)
From: SCC Media Library & Resource Center (library.scconline.org)