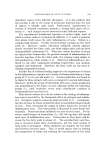
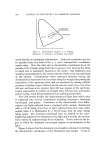
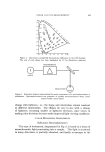
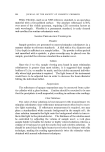
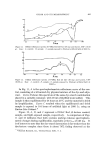
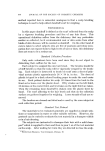
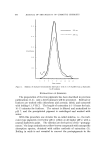
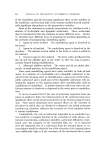
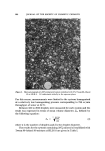
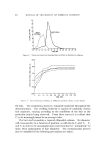
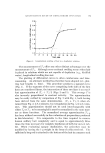
652 JOURNAL OF THE SOCIETY OF COSMETI•2 CHEMISTS • • DOMINA ILL0 'C' ½• X F{gur½ 3. Chromaticity diagram (x,y) defining i]]um{nant C, dominant wavelength, and purity sured directly on tristimulus eolorimeters. Only two coordinates need to be specified since the total of the x, y, and z chromaticity coordinates equals unity. Here the color axis or chromaticity coordinates lie on the outside of the triangle going from blue to green to red, whereas the white to black axis or luminosity function is the center this brightness axis would be perpendicular to the screen with the white at the top and black at the bottom. Nonspectrum colors represent mixtures having the chromaticities represented at any point along the straight line joining the extremities of the spectrum locus and are produced by mixing suitable portions of radiant engery taken from the extreme short-wave (less than 440 m/•) and long-wave (greater than 680 m/•) regions of the spectrum. Colors represented by points on straight lines between the achromatic point C in Fig. 2 and the spectrum locus are called spectral colors. The CIE system divides the characteristics of light from which color is composed into several components including luminance, dominant wavdength, and purity. Luminance is the characteristic that differ- entiates the light reflected from a standard white sample, illuminated with a 100-W lamp, from that of light reflected from this same white sample when it is illuminated by a 200-W lamp with all other things being equal. The dominant wavelength may be defined as the wave- length that appears to be dominant in the light and is usually the most in- tense variety of radiant energy in the stimulus. Purity refers to the de- gree to which the dominant wavelength appears to predominate in the light. Figure 3 shows that the dominant wavelength is obtained by plotting the chromaticity coordinates of the illuminant and sample. A line is

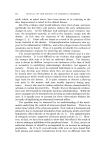
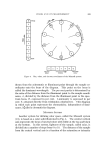
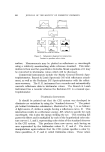
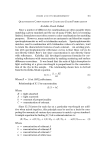
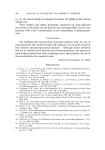
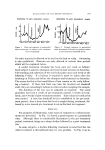
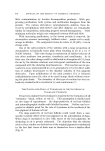
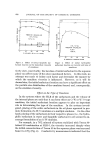
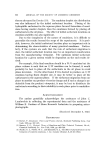
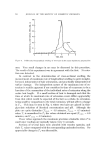
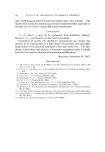
COLOR AND ITS MEASUREMENT 653 White Black 8 9 IO 1 2 3 5 .10 Figure Neutral • Saturated colour Chroma colour Hue, value, and chroma coordinates of the Munsell system drawn from the achromatic or illuminant point through the sample co- ordinates onto the locus of the diagram. This point on the locus is called the dominant wavelength. The per cent purity is determined by the ratio of the distance from the illuminant point to the sample coordi- nates, A, divided by the distance from the illuminant point to the spec- trum locus, B, expressed in per cent. Luminosity is expressed in per cent Y, obtained directly from tristimulus colorimeters. This diagram in which each point represents the chromaticity, independent of lumi- nance, ism, called a chromaticity diagram. MUNSELL SYSTEM Another system for defining color space, called the Munsell system (13), is based on a color solid illustrated in Fig. 4. The central vertical axis represents the locus of neutral colors with white at the top and black at the bottom. In this system, lightness of the sample, called value, is divided into a number of steps from 0 to 10. The distance of the sample from the central vertical axis is a function of the saturation or intensity
Purchased for the exclusive use of nofirst nolast (unknown)
From: SCC Media Library & Resource Center (library.scconline.org)