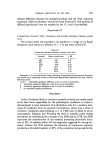
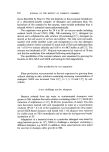
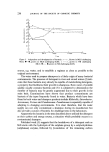
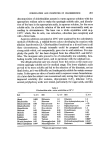
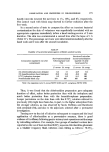
EVALUATION OF METHODS FOR MEASUREMENT OF ANTIPERSPIRANCY 251 Statistical analysis of a large amount of control data (no antiperspirant applied to either axilla) in our laboratory has shown that in some subjects the variations in sweating are such that the right to left ratio cannot be said to be constant. Table II Rates of R/L axillary sweating measured using a gravimetric method Observation 1 Observation 2 Day 1 1.39 0.65 Day 2 1.58 0.88 Day 3 1.94 1.68 Day 4 1.61 1.09 Day 5 2.03 1.42 The differences between the duplicate observations taken during one day and the differences between those found on different days are both significant at the 5% level. This means that considerable effort has to be expended in selecting the people who have the most constant ratios and are therefore most suitable for these tests. Even using these subjects it is often difficult to interpret results obtained from this type of experiment if the number of subjects in the panel is small, because of the scatter of results. In some cases the reduction, due to a particular product, is very good, in others poor, whilst some subjects apparently sweat more after treatment with a product than before. A typical experimental result is shown in Table IH. There are a number of ways in which the effects of these two products can be compared from this type of test. (1) The mean results over the whole panel, including or excluding the increases can be compared. Including increases Mean reduction due to product 1 = 7.7%. Mean reduction due to product 2 = 20.4%. Excluding increases Mean reduction due to product 1 = 31.6%. Mean reduction due to product 2 = 33.1%. (2) The averages of the statistically significant changes, including or excluding the increases can be compared.

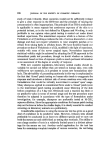
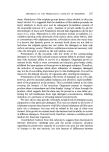
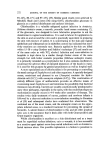
252 JOURNAL OF THE SOCIETY OF COSMETIC CHEMISTS Table IH The effects of antiperspirant products on axillary sweating Percentage change Subject Product 1 Product 2 1 - 20.2 q.31.5•' 2 -- 37.6* -- 15.9 3 -- 18.8 q- 4.9 4 +43.0* -- 60.4* 5 q.33.6 -- 40.4* 6 - 50.5* - 56.8* 7 + 8.0 - 2.0 8 +10.1 -68.7* 9 -- 39.8* +29.5 10 q- 2.0 -- 5.1 11 - 30.3•' - 45.4* 12 - 23.9 - 18.3 13 +21.8 - 16.3 q., Indicates increased sweating -, indicates decreased sweating *, significant at 5 % level •', significant at 10% level. Including increases Mean reduction due to product 1 = 13.1•o. Mean reduction due to product 2 = 40.0•o. Excluding increases Mean reduction due to product 1 = 39.1•o. Mean reduction due to product 2 = 54.4•o. (3) The results which are not statistically significant can be taken as zero and the significant results averaged over the whole of the panel, includ- ing or excluding the increases. Including increases Reduction due to product 1 = 6.0•o. Reduction due to product 2 = 18.0•o. Excluding increases Reduction due to product 1 = 14.4•o. Reduction due to product 2 = 22.6•. (4) A table can be drawn where the results are listed according to the type of response:
Purchased for the exclusive use of nofirst nolast (unknown)
From: SCC Media Library & Resource Center (library.scconline.org)