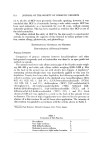
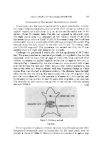
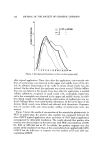
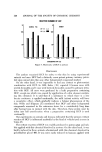
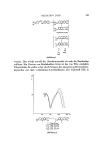
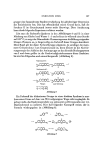
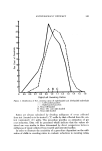
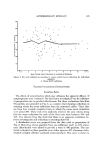
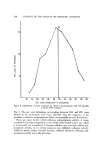
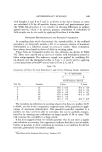
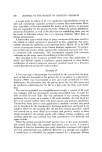
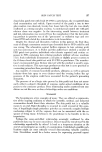
146 JOURNAL OF THE SOCIETY OF COSMETIC CHEMISTS 10, A 1'0 1'5 2'0 2• 3•) •5 ,•0 4'5 5•) 5'5 •0 •5 Per Cent Reduction in Sweating Figure 3. Distribution of sweat reductions by effective antiperspirants with 100 panelists A. Mean 39.0% reduction Fig. $. The per cent reductions in sweating between 10% and 65% were plotted at 5% increments. This curve indicates that the responses of the panelists to effective antiperspirants follow an essentially normal distribution. There are many factors which influence antiperspirant activity. A minor variation in formula composition is one of the most critical and is one which is occasionally not recognized. A formula additive may seriously inhibit anti- perspirant activity, or in certain instances may definitely enhance activity. Additives which reduce formula irritancy without adversely affecting anti- pcrspirant activity are in this last class.

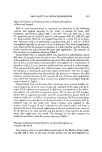
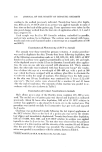
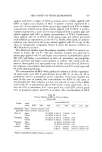
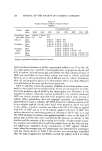
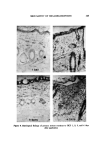
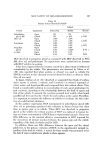
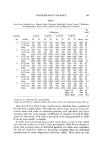
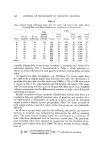
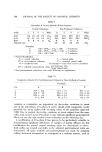
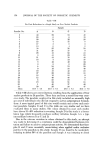
ANTIPEBSPIRANT EFFICACY 147 There is marked panelist-to-panelist variation in responses to many fac- tors. We have had the occasion to observe some samples, such as unformu- lated aluminum chloride, which reduce sweating of some panelists by 40-50% and increase sweating of other panelists by a similar amount. Panelists show- ing marked increases in sweating (properspirant activity) will usually show visual axillary irritation. However, we have observed many instances in which samples which are effective on most panelists exhibit no antiperspirant ef- fect-or even properspirant activity-on some panelists and there is no visual evidence of axillary irritation. This would indicate that there is some factor other than inactivation of antipcrspirant activity by formula components which results in certain panelists' specificity of decreased individual efficacy. This is discussed more specifically later in this presentation. Sweat Collection Temperature Several studies have been carried out in which antiperspirant activity was determined from sweat collections made in the 100øF room and under am- bient conditions on successive days. The ambient collections were made dur- ing 3-hour periods during which the sweat collection pads were held in the axillae by means of commercially available dress shields. Results from three such studies are summarized in Table IV. Table IV Comparison of Activity at 100øF and Ambient Temperature (Results Shown as Per Cent Reductions) Collection Conditions No. of Study Test Material Panelists 100øF Ambient I Commercial Roll-on - 20 32.2 ___ 6.9 32.5 ___ 9.6 2 Aerosol Powder A 24 9,3.0 ___ 4.4 9,6.0 __+ 5.0 2 Aerosol Powder B 24 8.0 __+ 3.9, 9.0 ___ 5.3 3 Aerosol Powder A 19, 25.5 ___ 8.1 9,1.0 +__ 9.2 3 Aerosol Powder B 12 27.4 ___ 7.0 9,6.6 __+ 11.0 Method o[ Data Analysis There are several commonly applied procedures for estimating antiperspi- rant activity. Data from four studies were evaluated by three different pro- cedures. The same data were used in each of these three evaluations. In all studies the test materials were applied to one axilla of each panelist follow- ing a series of control collections prior to sample application. The outline shown in Table V will facilitate description of the evaluations. The per cent reduction values and 95% confidence limits as determined by each procedure are listed in Table VI. Procedure A is subject to greatest
Purchased for the exclusive use of nofirst nolast (unknown)
From: SCC Media Library & Resource Center (library.scconline.org)