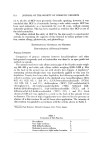
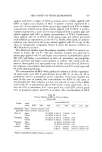
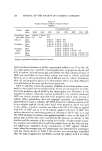
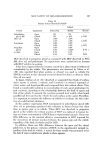
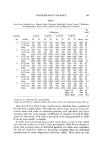
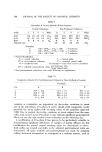
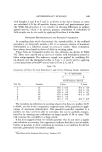
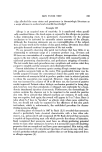
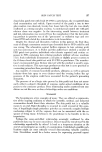
144 JOURNAL OF THE SOCIETY OF COSMETIC CHEMISTS T, able III Unadiusted and Adjusted Control Sweating Ratios Collection Panelist No. No. 1 2 3 4 5 6 7 8 9 10 11 12 Unadjusted lB 1C 2B 2C 3B 3C 4B 4C Mean 1.272 0.953 0.913 0.717 0.927 0.602 1.230 1.053 1.028 0.836 0.688 1.169 1.541 1.111 0.916 0.862 0.991 0.722 1.005 0.961 0.941 0.801 0.723 1.072 1.271 1.203 0.746 0.831 1.098 0.730 1.051 1.238 1.094 0.705 0.692 1.245 1.440 1.358 0.887 0.816 1.121 0.801 1.013 1.171 1.014 0.710 0.625 1.348 1.297 0.'852 0.775 0.625 1.074 0.921 1.313 1.191 0.931 0.895 0.645 1.183 1.412 0.901 0.896 0.665 1.168 0.817 0.947 1.116 0.931 0.792 0.540 1.249 1.421 0.946 1.070 0.598 1.018 0.727 0.990 0.966 1.305 0.860 0.756 1.369 1.381 1.053 0.986 0.580 1.051 0.834 0.853 0.936 1.090 0.727 0.•87 1.312 1.379 1.047 0.898 0.711 1.056 0.769 1.050 1.079 1.041 0.790 0.669 1.243 Adjusted lB 0.922 0.910 1.017 1.008 0.878 0.783 1.171 0.976 1C 1.117 1.061 1.020 1.212 0.938 0.939 0.957 0.891 2B 0.922 1.149 0.831 1.169 1.040 0.949 1.001 1.147 2C 1.044 1.297 0.988 1.148 1.062 1.042 0.965 1.085 3B 0.941 0.814 0.863 0.879 1.017 1.19'8 1.250 1.104 3C 1.024 0.861 0.998 0.935 1.106 1.062 0.902 1.034 4B 1.030 0.904 1.192 0.841 0.964 0.945 0.943 0.895 4C 1.001 1.006 1.098 0.816 0.995 1.085 0.812 0.867 Mean 1.000 1.000 1.001 1.001 1.000 1.000 1.000 1.000 Std. dev. 0.063 0.152 0.109 0.147 0.067 0.117 0.134 0.101 Std. error 0.022 0.054 0.039 0.052 0.024 0.041 0.047 0.036 Mean 1.000 Standard error of mean of all values 0.011 0.988 1.058 1.028 0.940 0.904 1.014 1.081 0.862 1.051 0.892 1.034 1.002 0.974 0.899 0.934 1.084 0.894 1.133 0.964 0.952 0.894 1.003 0.807 1.005 1.254 1.089 1.130 1.101 1.047 0.920 1.027 1.056 1.001 1.001 1.001 1.000 0.113 0.084 0.093 0.075 0.040 0.030 0.033 0.027 Table III shows a set of control sweating ratios which was taken from a ran- domly selected study. This table presents 8 individual control sweating ratios from each of 12 panelists, the mean control sweating ratios, and the individual control sweating ratios oeol]owing adjustment by dividing them by the indi- vidual panelists' mean control ratios. The mean adjusted control ratio by this procedure will always be 1.000, but the standard deviations ooe individual ra- tios adjusted to a uniform base ooe 1.000 will vary. The group mean and the standard error ooe the mean of the adiusted control ratios are shown. These values are used in calculating the sweat reduction values and their confidence limits in actual evaluations of antiperspirant activity. Since evaluations are based on individual post-treatment days, the standard error oeor each post- treatment day should be taken as a truer estimation of test sensitivity-ap- proximately -+5% at the 95% confidence level. This represents data from only 12 panelists. With larger panels the sensitivity is considerably greater.

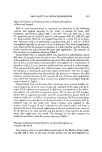
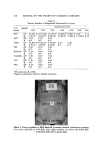
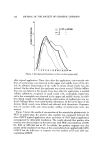
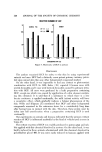
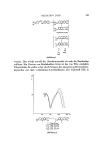
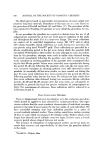
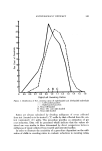
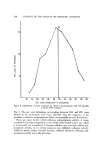
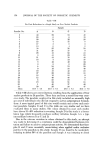
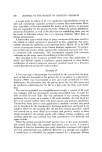
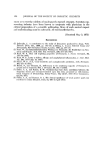
ANTIPERSPIRANT EFFICACY 145 10' A 2 3 • • • f • • 1•) 11 11 Mean Oontrol Sweat Oollections in Hundreds of Milligrams Figure 2. Per cent reduction in s•veating rs. mean control s•veat collections oeor individual panelists A. Mean 39.0% reduction FACTORS INFLUENCING EFFECTIVENESS Sweating Rates The effects of several factors which may influence the apparent efficacy of antiperspirants were evaluated. The first factor investigated was the influence of perspiration rate on product effectiveness. For these evaluations data from 89 panelists are presented in Fig. 2, as a scatter chart showing reductions in sweating versus the sweat collections from the untreated axillae. These data are from four recently completed tests in which the mean sweat reductions were about 39%. These tests were randomly selected, the only criteria being that the mean reductions for each of the four tests were between 38% and 41%. It is obvious from this chart that there is no apparent correlation be- tween sweating rate and reductions in sweating observed. A distribution curve was prepared from the data used in preparation of Fig. 2. Data from eleven panelists from one additional study on 10% alumi- num chlorohydrol were added to provide a total of 100 panelists. The ma- terials evaluated on these panelists were either aqueous 10% aluminum chlor- ohydrol or highly effective marketed aerosol products. This curve is shown in
Purchased for the exclusive use of nofirst nolast (unknown)
From: SCC Media Library & Resource Center (library.scconline.org)