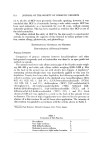
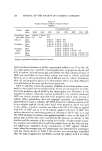
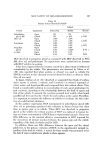
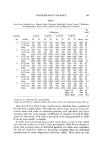
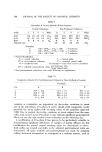
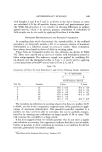
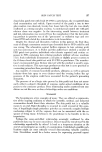
150 JOURNAL OF TIlE SOCIETY OF COSMETIC CHEMISTS Table VIII Per Cent Rednctions in a Single Study on Fonr Market Prodncts Sample Panelist No. A B C D I 40 52 53 46 2 20 0 0 18 3 29 11 12 29 4 10 7 16 0 5 17 3 0 0 6 10 0 4 0 7 30 25 32 59 8 31 20 37 5 9 28 43 52 43 10 6 41 23 23 11 21 41 38 49 12 18 5 13 37 13 6 42 42 34 14 0 0 0 28 15 0 34 53 59 16 0 13 18 40 17 15 47 42 23 18 27 28 19 16 19 16 12 12 0 20 12 40 46 9 21 2 22 19 6 22 15 34 51 16 23 I 42 37 48 24 20 28 26 47 Mean 15.6 ñ 4.5 24.6 4-_ 6.4 26.9 ñ 7.2 26.5 ñ 7.8 Table VIII shows per cent reductions resulting from the application of four market products to 24 panelists. These data are from a recent four-way cross- over study. The panelists employed in this study included an unusually high per cent of individuals who did not respond to active antiperspirant formula- tions. A more typical panel of this size would contain one or two such resis- tant panelists. Samples B and C in this table are very similar and we have evaluated them in many studies. The values obtained in most such studies have shown 35-40% reduction in sweating. Sample D in this study is a formu- lation type which frequently produces axillary irritation. Sample A is a type intermediate between B or C and D. Due to the extreme variation in values obtained in this study, an attempt was made to determine if a correlation could be demonstrated between irri- tation and failure to achieve antiperspirant activity. We determined that Sam- ples B and C were essentially nonirritating when applied under occlusive patches to the panelists in this study. Sample D was found to be moderately irritating to about 50% of the panelists and Sample A was irritating to about

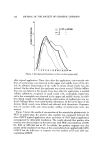
ANTIPERSPIRANT EFFICACY 151 25% of the panelists. Distinct correlation between irritancy and poor efficacy •vas not demonstrated, ho•vever. That is, some individuals who showed irrita- tion also showed marked reductions in sweating, and others who showed little or no antiperspirant effect did not show irritation from the patch applications. The fact that seven of these panelists (Nos. 1, 3, 7, 9, 11, 18, and 24) show similar responses to all four products, and six others ( Nos. 8, 10, 13, 15, 19, and 23) show similar responses to three of the four samples indicates that all sam- ples are properly formulated to achieve expected efficacy. The variations in responses observed in the remaining 12 panelists are apparently due to spe- cific individual differences. It is particularly inadvisable to exclude panelists on the basis of failure to sho•v antiperspirant activity ff the developed formu- lation is for use in substantiating claims for specific reductions in sweating. By the use of selected panelists we could achieve mean sweat reduction val- ues twice that obtained from a nonselected random population. Panelists are excluded •vho fail to consistently yield at least 100 mg of sweat from each axilla during control collections. These are less than 1% of the panelists en- rolled. The only other basis for exclusion is the lack of reasonable uniformity in control sweat collection ratios. These probably represent individuals who will not abide by standard precautions which are necessary in order to obtain reproducible values and very few such panelists are encountered. Most pane- lists can be readily indoctrinated in the proper regimen. We have occasionally heard the comment that the outlined procedures are not accurate since submitted samples do not show a dose response curve. We have demonstrated in several studies, most of which were carried out early in the development of our procedure about 15 years ago, that typical dose re- sponses are obtained with active aluminum salts. However, a plateau of maxi- mum reductions is reached at concentrations considerably below concentra- tions present in essentially all typical market products. Recently, •ve ca•ied out comparative studies on 7% and 10% aqueous so- lutions of aluminum chlorohydrol. In this study the mean reductions in sweat- ing determined on 24 panelists one hour after 2, 3, and 4 once-daily applica- tions were 26% from the 7% solution and 45% from the 10% solution. In a similar recent study on 10% and 20% aluminum chlorohydrol solutions, the value for the 10% solution was 42% and 39% for the 20% solution. Unfortu- nately, we do not have data on sufficient intermediate concentrations to ac- curately plot a concentration response curve. During the past three months we have been accumulating data from pane- list questionnaires from •vhich we hoped to be able to arrive at an estimation of practical significance of reductions in sweating determined in controlled laboratory studies. Our goals were to ansivet two questions: Is there a corre- lation between milligrams of sweat collected and panelist complaints of sweating during normal daily activities, and at what level of laboratory dem- onstrated reduction in sweating is there a noticeable difference in axillary
Purchased for the exclusive use of nofirst nolast (unknown)
From: SCC Media Library & Resource Center (library.scconline.org)