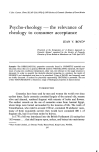
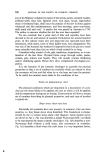
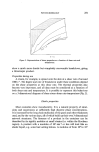
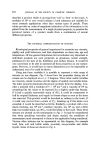
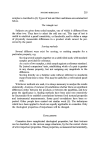
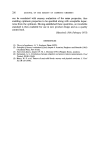
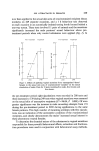
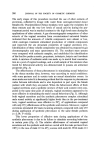
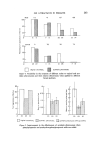
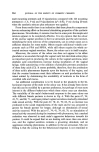
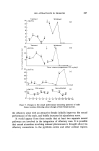
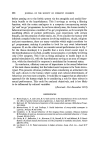
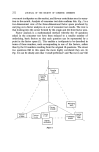
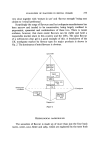
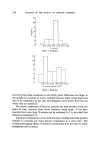
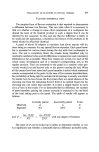
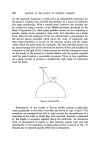
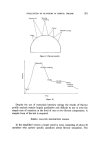
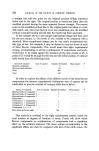
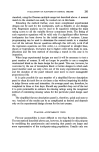
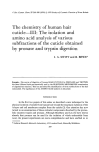
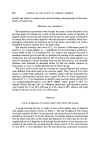
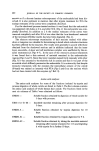
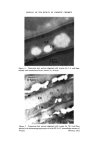
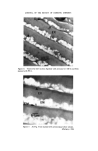
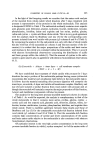
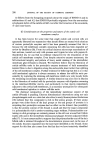
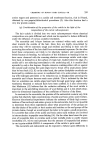
EVALUATION OF FLAVOURS IN DENTAL CREAMS 281 Peppermlni Burning lx -numbing holky ooih-syrupy Figure 9. Flavour profile. Peppermint Burning-numbing C halk-•.___ Smooth• texture Bitter -burning -cooling• Sweet ? Time Figure 10 Despite the use of numerical intensity ratings the results of flavour profile analysis remain largely qualitative and difficult to use in even the simple case of variation in the level of one or two flavour components. A simpler form of the test is required. SIMPLE FLAVOUR DESCRIPTION PANELS In the simplified version a larger panel is used, consisting of about 30 members who answer specific questions about flavour sensations. The

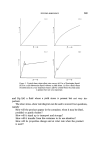
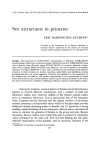
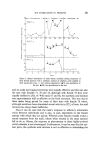
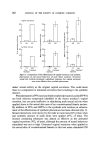
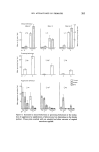
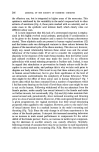
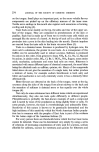
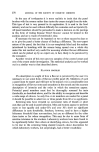
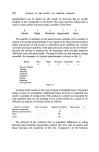
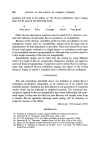
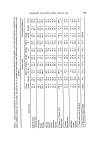
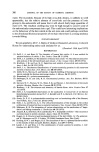
282 JOURNAL OF THE SOCIETY OF COSMETIC CHEMISTS questionnaire can be based on the results of previous flavour profile analysis of the toothpastes to be tested. The same intensity rating scale is used or some similar five-point scale, possibly of the form 0 1 2 3 4 Absent Slight Moderate Appreciable Great The number of members on the panel is some multiple of the number of creams to be tested and preferably in the region of 30. Using random number tables allocations of test cream to individual panel members are worked out such that equal numbers of the panel use each cream on the first brush- ing and the process is repeated for all brushings until all panel members will brush once with each cream. The panel is then run and intensity ratings recorded. An example of a typical questionnaire is shown in Fig. 11. Rating None Slight Moderate Appreciable Very 0 1 2 3 4 Flavour strength Tingling Warming Sweetness Freshness Drying Bitterness Lasting flavour Figure 11 Analysis of the results of this type of panel is straightforward. The panel design is that of a completely randomized block and can be subjected very easily to analysis of variance (12). This analysis is carried out separately for each question and, for the example of six creams tested by a panel of 30, will give an analysis of variance table as follows/ Source of variation Sum of squares Degrees of freedom Mean square Between toothpastes ........... 5 ........ Between panel members ........... 29 ........ Error ............ 145 ........ Total ............ 179 F The removal of the variation due to systematic differences in rating between panel members appreciably reduces the error sum of squares and hence increases the sensitivity of the test. Comparison of' the between
Purchased for the exclusive use of nofirst nolast (unknown)
From: SCC Media Library & Resource Center (library.scconline.org)