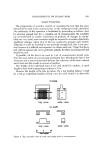
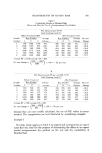
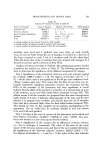
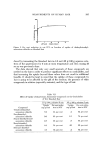
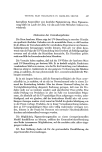
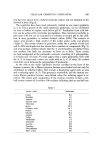
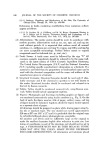
MEASUREMENTS ON HUMAN ttAIR 391 Source of Variance Table IV Analysis ooe Variance for Data in Table II Sums of Squares Degrees of Freedom Mean Squares t•etween rows 185,415.7 m -- 1 = 7 Between columns 9,052.5 n._, -- 1 = 1 Row X column interaction 14,459.6 ( n, -- 1 ) x (•n2 -- 1 ) = 7 Residual 73,495.6 n,n,•(m -- 1) = 64 Total 282,423.4 mn=na -- 1 = 73 equals number of rows equals 8 (one for each swatch). equals number of columns equals 2 (one for each treatment). equals number of replications equals 5 (five for each swatch). 26,488. 9,052.5 2,065.7 1,148.4 swatches were used and 5 replicate runs were done on each swatch: It can be seen in Table II that the use of shampoo A resulted in a decrease of the forces required to comb 7 out of 8 swatches used. On the other hand, Table III shows that of the 8 swatches that were treated with shampoo B, 3 showed an increase and 5 a decrease in their PCLs. Analysis of Variance for Data in Table II. The statistical parameters needed to perform the analysis are shown in Table IV. The following operations are done to determine the significance of the different components of variance. Step 1. Significance of the interaction (between rows and columns) against the residual: 2,065.7/1,148.4 = 1.79. For degrees of freedom (dr) Nt = 7, N2 = 64 the above ratio is not significant at the 95 per cent confidence level. (Fisher variance ratio test.) This means that the data do not show any de- tectable statistically significant interaction between the treatment and the PCLs of the swatches. If the interaction had been significant, it would indicate that the effect of the product is a function of a characteristic of some of the swatches, in our case their initial before treatment average PCL. This seldom ,occurs if all the swatches are prepared from the same homogeneous batch of hair. If it does, it indicates inhomogeneity of the hair, m•d the best solution is to prepare more swatches and exclude from the set of swatches those that have extremely high values for their initial before treatment PCL. This should be done on the complete set of swatches participating in the experiment. The set would then be randomly divided in half into subsets to be used with each product. Step 2. Pooling of the sums of squares of the interaction and residual and their degrees of freedom: (14,459.6 q- 73,495.6)/(7 q- 64) = 1,238.8. This num- ber is now treated as a new mean square for the residual. Step 3. Significance of the variance due to differences between columns (i.e., due to shampoo A treatment). The value of the ratio of the mean square of the between columns term and that of the new residual determines the significance of the "between columns" varim•ce: 9,052.5/1,238.8 = 7.31. For degrees of freedom N• = 1 and N2 = 71 the value of the ratio indicates

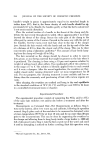
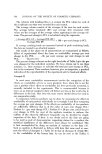
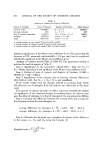
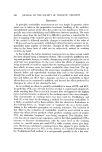
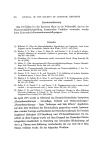
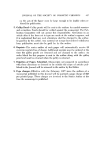
392 JOURNAL OF THE SOCIETY OF COSMETIC CHEMISTS Table V Analysis of Variance for Data in Table III Source of Variance Sums of Squares Degrees of Freedom Mean Squares Letween rows 133,028.0 n• -- 1 = 7 19,004.0 Between columns 32.5 n,, -- i = 1 32.5 Row X column interaction 13,401.0 ( n•- 1 ) x (,n•-- 1 ) =7 1,914.4 Residual 59,972.0 n,n,,(m -- 1) = 64 937.1 Total 206,433.5 mn.,n• -- I = 73 nt equals number of rows equals 8 (one for each swatch). n• eqnals number of columns equals 2 (one for each treatment). n• equals number of replications equals 5 (five for each swatch). statistical significance at the 99 per cent confidence level. This means that the decrease in PCL measured experimentally (-15. per cent) can be considered statistically significant at the 99 per cent confidence level. Analysis of Variance l•or the Data in Table III. The parameters needed to perform the analysis appear in Table V. Step 1. Significance of the interaction: 1,914.4/937.1 = 2.04. For N• = 7, N•o = 64 the interaction is not significant at the 95 per cent confidence level. Step 2. Pooling of sums of squares and degrees of freedom: (13,401. + 59,972.)/(7 + 64) = 1,033.4. Step 3. Significance of the variance due to between columns differences: 32.5/1,033.4 = 0.31. For N• = 1, N2 = 71 is not significant. These results confirm that the changes noticed on combing loads (Table III) after the use of shampoo B do not indicate any effect due to this treat- ment. The analysis of variance provides us with a criteria to establish the statisti- cal significance of the observed changes in combing forces. In order to com- pare the effect of shampoo A to that of shampoo B we can proceed as follows. Step a. Calculate the difference between the average after and average be- fore treatment values for each shampoo, i.e., average difference for shampoo A = D^---116.8- 138. =-21.2 g average difference for shampoo B--D•, = 124.5- 123.2 = 1.3 g Step b. Calculate the standard error (standard deviation) of the difference in the means, i.e., Dx and D, using the formula (5) Standard error- rr x N/2: O'm ¾n
Purchased for the exclusive use of nofirst nolast (unknown)
From: SCC Media Library & Resource Center (library.scconline.org)