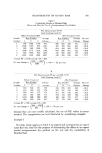
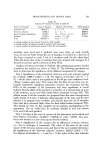
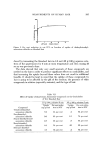
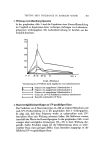
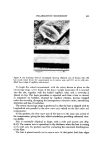
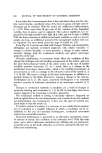
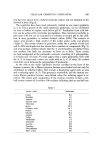
MEASUREMENTS ON HUMAN HAIR Table I Combability Results on Bleached Hair Before and After the Use of a Semipermanent Dye Product A 387 Wet Measurements 70øF) Peak Combing Load (G) Before Treatment (BT) After Treatment (AT) Swatch Run Number Average Run Number Average Per cent Number 1 2 3 Column 1 2 3 Column Change 1 700. 1050. 1160. 970. 980. 820. 320. 707. --27.1 2 1500. 1125. 925. 1183. 366. 360. 664. 463. --60,9 3 525. 690. 1000. 738. 664. 422. 460. 515. --30.2 4 1200. 1175. 1210. 1195. 650. 900. 616. 722. --39.6 5 850. 1950. 825. 1208. 436. 500. 480. 472. --60.9 6 1845. 1425. 1550. 1607. 440. 350. 530. 440. --72.7 Average BT = 1150, average AT = 553. Per cent change = (55•50!150') X 100 = --52. per cent. Dry Measurements (65 per cent RH, 70 øF) Peak Combing Load (G) Before Treatment After Treatment Swatch Run Number Colnmn Run Number Average Per cent Number 1 2 3 Average 1 2 3 Column Change 1 800. 530. 784. 705. 236. 258. 220. 238. --66.3 2 416. 390. 304. 370. 200. 247. 140. 196. --47.0 3 500. 340. 275. 372. 263. 19 •. 140. 200. --46.2 4 48S. 365. 399. 417. 275. 310. 255. 280. --32.9 5 1180. 800. 500. 827. 400. 210. 370. 327. --39.5 6 620. 550. 650. 607. ]87. 155. 25,6. 200. --32.9 Average BT = 550, average AT = 240. (240. -- 550.• Per cent change: •, •. ] X 100 = --56 per cent. because they are more readily calculated, the use of PCL values is recom- mended. The computations are best illustrated by considering examples. Example I The data, which appears in Table I are typical and correspond to an experi- ment that was done for the purpose of determining the effect of an experi- mental semipermanent dye product on the wet and dry comb ability of bleached hair.

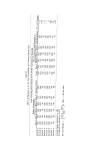
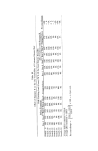
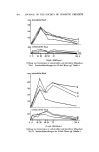
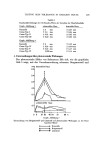
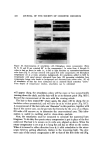
388 JOURNAL OF TIlE SOCIETY OF COSMETIC CHEMISTS The columns with headings Run 1-3 contain the PCL values for each of the 3 replicate runs that were recorded for each swatch. The average column consists of the averages of the runs for each swatch. The average before treatment (BT) and average after treatment (AT) values are the averages of the average values appearing in the average col- umns. The per cent change in PCL is calculated using the expression ( Average PCL AT - Average PCL BT ) x 100 = per cent change in PCL Average PCL BT If average combing loads are measured instead of peak combining loads, the data are treated in an identical manner. the results of the above set of measurements are summarized as follows. Effect of experimental direct dye base on combability: average per cent change in dry PCL .... 56. per cent average per cent change in wet PCL .... 52. per cent. The percent change columns on the right hand side of Table I give the per cent changes for the individual swatches. We have chosen not to use these numbers, i.e., their averages, to calculate the total per cent change in PCL, due to the treatment. These m•mbers, however, give, on inspection, a practical indication of the reproducibility of the experiment and/or treatment effects. Example II In most cases, combability measurements involve the comparison of the e.%cts on combability of two or more products. Even when this is not the case, a product whose effect .on combability has been previously measured, is normally included in the experiments. This is recommended because it serves as an internal standard which will detect any bias in the results due to differences in the hair. Hair from the same source should always be used in any comparative study. A comparison between products can be done by measuring the effect on combability of each product individually as in example I and then comparing the average per cent changes. If the effects on comb'ability of t•vo products are sufficiently different, that is, of the order of (per cent change PCL) Product A- (per cent change PCL) Product B • 20 per cent, and if the per cent change in PCL for most of the replicate swatches is uniform, the validity of the observed difference frequently can be decided by simple inspection of the data. If there is any doubt and/or the data are going to be used as part of documentation supporting claims for a product, the statistical significance of the differences must always be established. This is best accomplished by doing an analysis of variance on the data (4). Such an analysis is illustrated as follows with data that were used to com- pare the effect of shampoo A (Table II) to that o.f shampoo B (Table III) on the combability of dry human hair. As can be seen in the Tables, 8
Purchased for the exclusive use of nofirst nolast (unknown)
From: SCC Media Library & Resource Center (library.scconline.org)