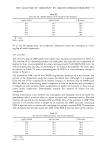
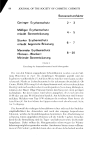
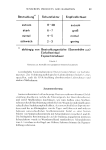
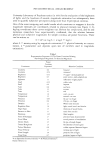
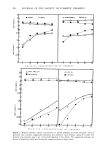
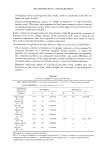
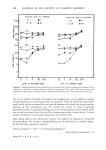
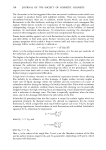
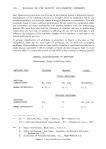
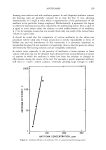
PSYCHOPHYSICAL MEASUREMENT 97 to illustrate ratios of perceptions and, finally, yields a continuous scale with no upper nor lower bounds. Degree of liking/disliking, using a "0" (dislike extremely) to "9" (like extremely) hedonic scale. (This latter scale represents a fixed-point category scale in contrast to magnitude estimation scales, which have no fixed upper or lower limits and are continuous rather than discrete.) Figure 2 shows the average ratings for the odorants. Table III provides the estimates of functions that fit the average ratings. Power functions were used to describe the magnitude estimation data, and logarithmic functions (where they could be fitted) were used to describe the hedonic, category rating data. The important things about the data shown in Figures 2a and 2b and Table III are: Odor intensity, whether of simple or of complex odorants can be evaluated by untrained panelists. In a relatively complex testing situation, in which the panelists are confronted with odorants of varying concentrations and qualities, the untrained panelists can adequately discriminate and scale differences of hedonics and intensity. Thus, experimentally, at least 30 different odorants can be evaluated under a regimen that permits about 1-2 rain rest between odorants. Relatively small-sized panels of individuals provided stable useable data and functions in this study. (Such small samples are common in psychophysical studies.) Table III Intensity And Hedonic Functions For Odorants LOG: ODOR INTENSITY = K, (Log Concentration a) q- K 2 (K• = Power function exponent) ODOR HEDONICS = K 3 (Log Concentration a) q- K 4 ODORANT (Number of panelists) INTENSITY HEDONICS K• K• R b K 3 K 4 R b Ethyl Vanillin 0.55 1.54 0.39/0.99 0.39 5.79 0.18/0.90 (N = 28) Heliotropin 0.44 1.13 0.37/0.97 -- -- -- (N = 30) Pine Oil 0.44 2.06 0.41/0.% -- -- -- (N = 42) Terpineol 0.8 2 2.02 0.56/0.% -- -- -- (N = •1) D Carvone 0.22 2.81 0.29/0.98 -- -- -- (N = 44) Indole 0.32 2.07 0.32/0.89 --0.49 2.23 --0.19/--0.91 (N = 44) Hydrocoumarin 0.06 1.95 0.10/0.85 -- -- -- (N = 38) Sage Oil 0.37 2.37 0.43/0.95 -- -- -- (N = 45) apercentage concentration in diethyl phthalate. bFirst R = Pearson correlation for unaveraged data. Second R = Pearson correlation for average data (across all individuals) R varies between q- 1 (perfect relation), 0 (no relation), and -- 1 (perfect inverse relation). -- Means that no simple linear function could be fitted.

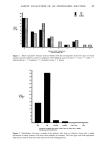
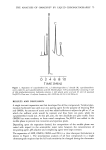
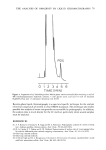
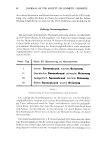
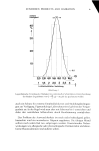
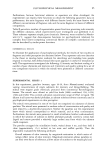
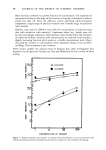
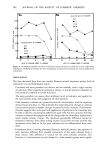
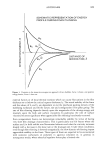
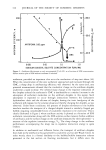
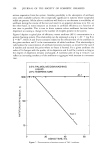
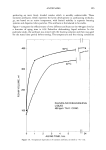
98 JOURNAL OF THE SOCIETY OF COSMETIC CHEMISTS Odor intensity conforms to a power function of concentration. The exponent of the power function (or the slope of the function in log-log coordinates) is almost always less than 1.0. Thus, the olfactory system governing smell perception compresses a larger range of physical variation into a smaller range of perceived odor intensity. Hedonic tone varies in different ways with the concentration of odorants (and thus with subjective odor intensity). Unpleasant odors (e.g., indole, sage oil) become increasingly unpleasant. Some pleasant odors exhibit either flat functions (in which the hedonic variations with concentration are random) or else exhibit a slightly increasing function which peaks at a middle concentration level. Above that peak the increase in concentration either diminishes liking or has no effect on liking. This last pattern is rare, however. These results confirm the general trend of findings that other investigators have reported over the past two decades, see Cain and Moskowitz (6) for a review of direct scaling. 4 16 CONCENTRATION OF ODORANT Figure 3. Relation between concentration of odorant (four-fold dilutions in air) and perceived odor intensity and liking (hedonics) of pulegone and limonene, respectively. All coordinates are log-log.
Purchased for the exclusive use of nofirst nolast (unknown)
From: SCC Media Library & Resource Center (library.scconline.org)