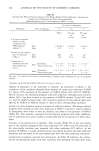
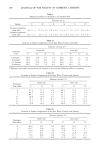
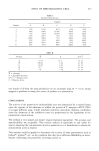
290 JOURNAL OF THE SOCIETY OF COSMETIC CHEMISTS Table I Elemental Analysis of the Surface of Untreated Skin Elements (at %) Sample C O N Si S P Untreated epidermis (outer side) 84.3 -+ 4 12.4 _+ 1.9 0.8 _+ 0.1 2.2 _+ 1.7 0.1 _+ 0.1 0.2 _+ 0.1 Untreated epidermis (inner side) 87.7 -+ 2 9.9 -+ 1.1 1.2 _+ 0.3 0.6 -+ 0.2 0.2 _+ 0.1 0.4 _+ 0.1 Table II Variation in Surface Composition of the Skin When Treated with Ether Elements (Atomic %)* Outer side Inner side Treatment Time C O N Si C O N Si Untreated 86.5 10.8 0.9 1.8 89.6 8.9 1.1 0.4 30 seconds 85.5 12.3 0.8 1.4 89.0 9.5 1.0 0.4 2.5 minutes 86.4 12.0 0.8 0.8 89.0 9.9 1.1 30 minutes 86.3 12.3 1.0 0.4 88.5 10.3 1.2 -- * Elements with small concentrations are omitted in this and the following tables for simplicity. Table III Variation in Surface Composition of the Skin When Treated with Acetone Elements (Atomic %) Outer side Inner side Treatment Time (Min) C O N C O N 0 87.3 11.9 0.8 88.1 11.0 0.9 2 84.2 14.4 1.4 84.7 13.0 3.0 7 84.1 14.0 1.9 81.3 13.3 5.4 17 78.8 16.6 4.6 74.1 16.4 9.5 27 73.1 18.7 8.1 71.5 16.3 12.2 37 75.1 17.3 7.6 71.4 16.6 12.0 47 72.8 18.4 8.8 69.0 17.5 13.5 Table IV Variation in Surface Composition of the Skin When Treated with Ethanol Elements (Atomic %) Outer side Inner side Treatment Time (Min) C O N C O 0 86.9 12.3 0.8 88.1 10.3 1.6 2 83.7 13.0 3.3 81.6 13.7 4.7 7 81.0 15.0 4.0 77.8 14.5 7.7 17 77.7 16.1 6.2 76.4 14.8 8.8 27 75.2 16.8 8.0 73.0 15.7 11.3 37 71.9 17.3 10.8 67.6 18.5 14.0

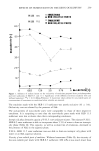
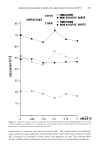
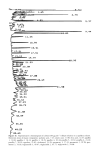
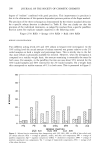
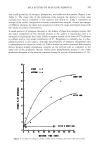
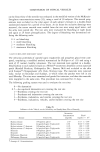
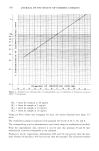
ESCA STUDIES OF SKIN LIPID REMOVAL 291 very small quantities of nitrogen, phosphorus, and sulfur are also present (Figure 1 and Table I). The inner side of the epidermis (side towards the dermis) in most cases contains less silicon compared to the exterior side (Table I). Table I represents an average of the surface composition of twelve untreated skin samples. Atomic percentages of different elements for these skin samples lie within the range mentioned along with the values of atomic concentration. A small quantity of nitrogen observed at the surface of these skin samples implies that the major component of the material present at the surface is non-protein and it is assumed to be primarily skin lipid. Sulfur is present mainly in the form of S TM (sulfonate or sulfate) with a very small contribution of S u. Phosphorus is probably due to phos- pholipid present at the surface, although the possibility of inorganic phosphorus salts or phosphoprotein cannot be ruled out. ESCA studies on twelve untreated skin samples always showed smaller phosphorus contents on the exterior side as compared to the inner side of the epidermis. Recent studies show phospholipids present in the viable epidermis disappear in the stratum corneum during the process of keratinization (2, 14). 16 14 ACETONE o,e 12 o OUTER SiDE 2 ß rl OUTER S INNER SIDE ß 0 5 I0 15 20 25 30 :35 40 45 50 WASHING TIME (MIN.) Figure 2. Increase in nitrogen content of skin versus washing time with ether and acetone.
Purchased for the exclusive use of nofirst nolast (unknown)
From: SCC Media Library & Resource Center (library.scconline.org)