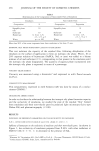
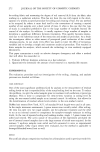
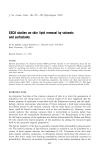
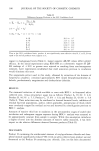
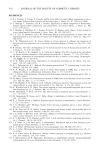
ASSAY OF IMIDAZOLIDINYL UREA 315 Edge of plote ! / / / / / ! Figure 1. Agar Petri dish zone of inhibition test.

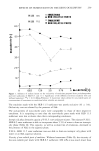
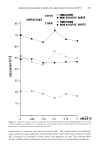
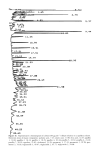
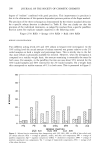
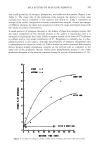
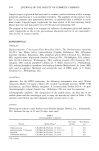
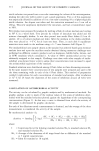
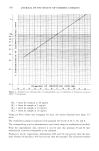
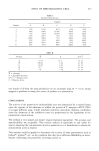
316 JOURNAL OF THE SOCIETY OF COSMETIC CHEMISTS 2 1 0.4- 0.3 0.2- 0.1 10 11 12 13 14 15 16 17 18 19 20 21 2•2 I F ' , I I '1 • t I • I I I • •' I I I I Figure 2. Standard curve showing effect of imidazolidinyl urea on inhibition of PJe//a'omo.ds ATCC 15442 growth. SS4 = Idem for standard at 20 mg/ml. SC• = Idem for sample at 5 mg/ml. SC2 = Idem for sample at 10 mg/ml. SC4 = Idem for sample at 20 mg/ml. Using six Petri dishes and averaging the data, the results obtained have about 5% error. The commercial products examined were assigned the letters A, B, C, D, and E. The corresponding activity measurements were found using the mathematical method. From the experimental data collected it can be seen that products B and D have antibacterial activities comparable to the standard. Products C and E, respectively, demonstrate 20% and 5% less activity than the stan- dard. Product A has about 30% less activity than the standard. The variations between
Purchased for the exclusive use of nofirst nolast (unknown)
From: SCC Media Library & Resource Center (library.scconline.org)