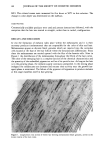
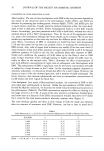
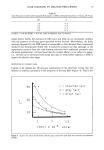
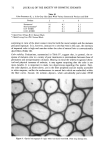
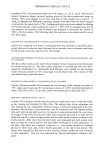
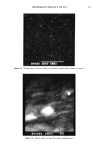
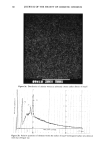
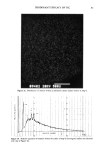
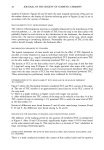
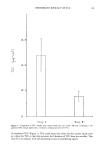
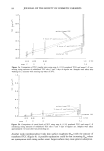
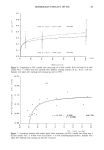
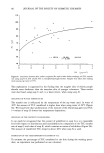
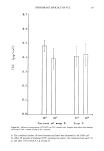
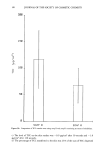
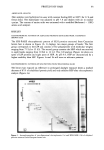
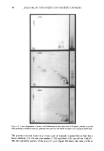
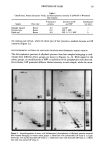
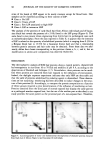
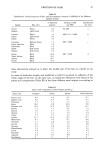
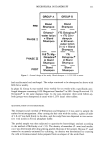
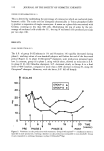
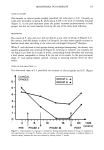
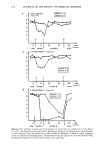
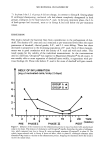
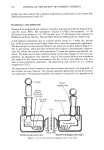
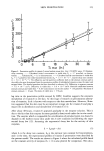
78 JOURNAL OF THE SOCIETY OF COSMETIC CHEMISTS SNIFF TEST COMPARING SOAPS C AND H The investigation was conducted as a double-blind study: a) On the first day the volunteers, who had refrained from using deodorant products for at least 24 hours and had used a deodorant-free soap, washed both axillae with a de- odorant-free placebo soap (= H). After this standardization procedure, the volunteers placed a ball of pure cotton under each axilla, wore a T-shirt made of cotton (washed with perfume-free detergents), and sat quietly for 30 minutes in a room with a tempera- ture of--30øC. After this period of slight sweating, the cotton balls were removed, sealed in a glass container free of noticeable smell and stored for 1-3 hours in a refriger- ator at 2øC. Thirty minutes before evaluation the glass jars were removed from the refrigerator and allowed to warm to room temperature (20øC). Two technicians experi- enced in this kind of investigation and with sensitive noses evaluated the atmosphere in every container according to quality and quantity of odor. The following scores were used to describe the odor: 0 = no odor 1 = odor just detectable 2 = odor of slight intensity 3 = odor of moderate intensity 4 = odor of strong intensity b) On the second day this procedure was repeated, except that soap C (containing 0.13% TCC) and soap H were used (random application sites). c) The scores (sum of two individual scores) characterizing each sample were compared by the paired t-test. RESULTS CONTENT OF TCC "SANDY" GRAINS The following procedure was used to determine whether the grains on the surface of the "sandy" soap cakes B had a high content of TCC and whether the inhomogeneity there- fore consisted mainly of deodorant: grains isolated from the surface of soap B contained aproximately 40 times the amount of TCC found in soap A. SPATIAL DISTRIBUTION OF CI AND Na IN SOAP CAKES B, C, AND F Figure 1 shows the distribution of chlorine--characterized by the little white spots-- in soap B, and Figure 2a presents the result of an analogous analysis of Soap F. The uneven distribution of chlorine in soap B is easily recognized when soap B is compared with soap F, i.e., the solubilization of TCC has the expected result. The low intensity of chlorine in Figure la compared with Figure 2a--both products contain 1.3% TCC --is probably a consequence of aggregation within soap B that inevitably will cause a decrease in dissolved or finely dissipated powdered compound. The presumably linear relationship between the number of white spots and the content of TCC can be esti- mated by comparing Figure 2a with Figure 3a, which represents the distribution and quanity of chlorine within soap C the reduction of solubilized TCC by a factor of 10 is expressed very well by the less intense, but even, distribution of chlorine. In contrast to chlorine, sodium is distributed very evenly in exactly the same area as used for the

DEODORANT EFFICACY OF TCC 79 Figure la. Distribution of chlorine within an arbitrarily chosen surface district of soap B. ee4ee 20Ku ' $u Figure lb. Surface district of soap B at higher magnification.
Purchased for the exclusive use of nofirst nolast (unknown)
From: SCC Media Library & Resource Center (library.scconline.org)